7 - Compute Stats
Eli Holmes
2021-08-31
Source:vignettes/7_compute_stats_along_coast.Rmd
7_compute_stats_along_coast.RmdThis example shows how work through the points along the 20km coastline and return the stats for each point.
The basics package our coastline, coastal sample points and the offshore 300km line.
data(package = "basics")Load the needed packages for plotting and data.
## Loading required package: raster## Loading required package: sp## Loading required package: ggplot2## Loading required package: basicsMake a function to get the nearest points on the 300 km line
We need to pass it our 300 km line as a data frame (long, lat, ID) along with the long-lat of a point on the coast. Little bumps in the coast and 300km lines cause the nearest points to be clustered around dips toward the coast. Simplifing the line helps prevent this. A tol about 50 seems to work. na.rm determines if NA are ignored or not.
# l is SpatialLines for 300 km line
# p is SpatialPoints of coastal point
NearestPoints <- function(l, p, tol=NULL) {
  if(!is.null(tol)) l <- rgeos::gSimplify(l, tol=tol)
  df <- c()
  n <- length(l@lines[[1]]@Lines)
  for (i in 1:n) {
    df <- rbind(df, cbind(l@lines[[1]]@Lines[[i]]@coords, ID = i))
  }
  pts <- p@coords
  close_coords <- matrix(NA, nrow(pts), 2)
  for (i in 1:nrow(pts)) {
    close_coords[i, ] <- maptools::nearestPointOnLine(df, pts[i, ])
  }
  close_sp <- sp::SpatialPoints(close_coords, proj4string = crs(l))
  return(list(coords = close_coords, sp = close_sp))
}
Make a function to get the average SST for these 300 km points
Because the raster might include islands, which would be NA, setting na.rm=FALSE means coastal points that are inside of an island will be NA.
# p is SpatialPoints the coastal points
# d is the distance (in whatever units p is in)
SST.offshore <- function(r, p, d = 100, na.rm=FALSE) {
  if(d==0){ # Get value at points
  vals <- raster::extract(r, p)
  return(vals)
  }
  # Get values in circle around points
  pts <- p@coords
  vals <- c()
  for(i in 1:nrow(pts)){
    pt <- sp::SpatialPoints(pts[i,,drop=FALSE])
    circle_pt <- raster::buffer(pt, width = d)
    vals <- c(vals, mean(raster::extract(r, circle_pt)[[1]], na.rm=na.rm))
  }
  return(vals)
}
Make a function to get the SST for the coastal points
If d=0 then it just returns the SST at the point. If d is not zero, it takes the average along l that is d to each side of the points.
SST.coast <- function(r, p, l=NULL, d=0) {
  if(d==0){
  vals <- raster::extract(r, p)
  return(vals)
  }
  if(is.null(l)) stop("If d is not zero, need the coastline.")
  pts <- p@coords
  vals <- c()
  for(i in 1:nrow(pts)){
    pt <- sp::SpatialPoints(pts[i,,drop=FALSE])
    circle_pt <- raster::buffer(pt, width = d)
    segment_pt <- raster::intersect(l, circle_pt)
    vals <- c(vals, mean(raster::extract(r, segment_pt)[[1]], na.rm=TRUE))
  }
  return(vals)
}
upwelling <- function(r, p, l.offshore, l.coast=NULL, d.offshore=100, d.coast=0, threshold=2.5, tol=NULL){
  coast.pts <- p
  offshore.pts <- NearestPoints(l.offshore, coast.pts, tol=tol)$sp
  off.sst <- SST.offshore(r, offshore.pts, d = d.offshore)
  coast.sst <- SST.coast(r, p, l=l.coast, d=d.coast)
  df <- data.frame(p@coords, offshore=off.sst, coast=coast.sst,
                   upwelling=(off.sst-coast.sst)>=threshold)
  colnames(df) <- c("longitude", "latitude", "offshore.SST", "coast.SST", "upwelling")
  return(list(df=df, offshore.pts=offshore.pts, tol=tol, threshold=threshold, d.offshore=d.offshore, d.coast=d.coast))
}
Now we can apply this to a set of points in our area of interest (WA/OR)
coast.pts <- raster::crop(sample_points$km100,
                       raster::bbox(raster::trim(sample_raster$raster.wintri)))
out <- upwelling(sample_raster$raster.wintri, coast.pts,
                 raster::crop(buffer300$wintri$line, raster::bbox(sample_raster$raster.wintri)), d.offshore=0, tol=50)
out$df
## longitude latitude offshore.SST coast.SST upwelling
## 1 -12493.95 4918.992 15.19896 12.50863 TRUE
## 2 -12433.31 4998.224 15.22791 11.96684 TRUE
## 3 -12380.88 5083.202 14.84340 10.79008 TRUE
## 4 -12346.74 5176.976 14.40797 11.29032 TRUE
## 5 -12288.96 5256.500 14.10876 13.25475 FALSE
## 6 -12220.06 5328.867 14.03954 13.74772 FALSE
## 7 -12159.37 5408.301 13.71599 13.71607 FALSE
## 8 -12098.16 5487.342 13.87686 13.66589 FALSE
## 9 -12043.62 5570.948 14.09663 14.51252 FALSE
## 10 -11994.36 5657.941 13.52844 14.68849 FALSE
## 11 -11961.75 5751.910 13.52844 14.37514 FALSE
## 12 -11958.03 5850.898 13.52844 13.33103 FALSE
## 13 -11989.70 5944.890 13.05134 12.16059 FALSE
## 14 -12054.15 6020.274 11.83306 12.42419 FALSE
## 15 -12084.07 6108.526 11.46756 11.45564 FALSE
## 16 -12105.10 6204.911 11.15663 NA NA
plot(sample_raster$raster.wintri)
plot(buffer300$wintri$line, add=TRUE)
plot(buffer20$wintri$line, add=TRUE)
plot(coast.pts, add=TRUE, pch=19, col=ifelse(out$df$upwelling, "red", "black"))
plot(out$offshore.pts, add=TRUE, pch=1)
title("coast points and corresponding offshore points")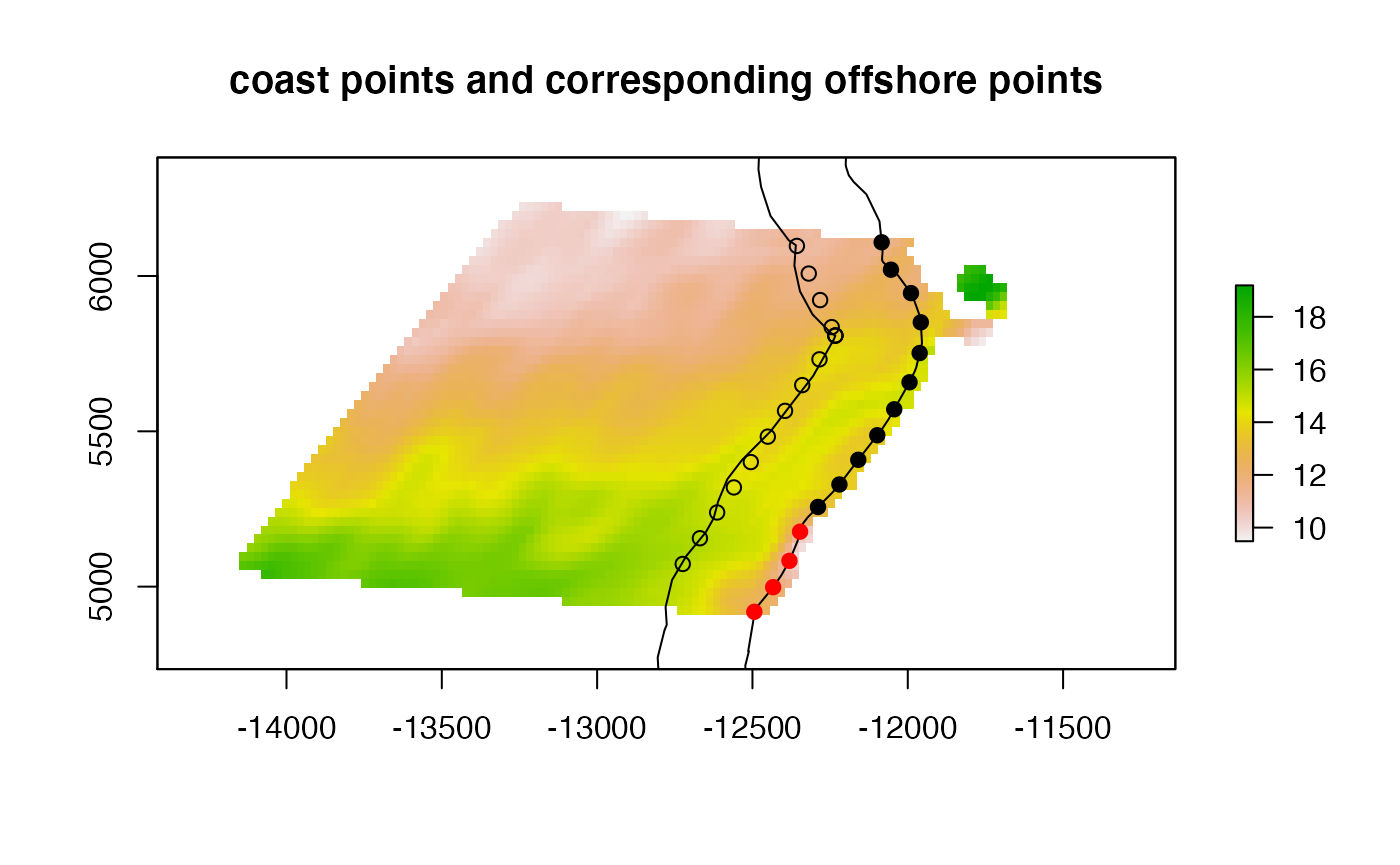
Coast points and corresponding offshore points. tol = 50 Offshore line is smoothed so points won’t fall on line.