Create some visualizations of the region#
Author: Andy Barrett
%pip install cmocean
Collecting cmocean
  Using cached cmocean-4.0.3-py3-none-any.whl.metadata (4.2 kB)
Requirement already satisfied: matplotlib in /srv/conda/envs/notebook/lib/python3.11/site-packages (from cmocean) (3.9.1)
Requirement already satisfied: numpy in /srv/conda/envs/notebook/lib/python3.11/site-packages (from cmocean) (1.26.4)
Requirement already satisfied: packaging in /srv/conda/envs/notebook/lib/python3.11/site-packages (from cmocean) (24.1)
Requirement already satisfied: contourpy>=1.0.1 in /srv/conda/envs/notebook/lib/python3.11/site-packages (from matplotlib->cmocean) (1.2.1)
Requirement already satisfied: cycler>=0.10 in /srv/conda/envs/notebook/lib/python3.11/site-packages (from matplotlib->cmocean) (0.12.1)
Requirement already satisfied: fonttools>=4.22.0 in /srv/conda/envs/notebook/lib/python3.11/site-packages (from matplotlib->cmocean) (4.53.1)
Requirement already satisfied: kiwisolver>=1.3.1 in /srv/conda/envs/notebook/lib/python3.11/site-packages (from matplotlib->cmocean) (1.4.5)
Requirement already satisfied: pillow>=8 in /srv/conda/envs/notebook/lib/python3.11/site-packages (from matplotlib->cmocean) (10.2.0)
Requirement already satisfied: pyparsing>=2.3.1 in /srv/conda/envs/notebook/lib/python3.11/site-packages (from matplotlib->cmocean) (3.1.2)
Requirement already satisfied: python-dateutil>=2.7 in /srv/conda/envs/notebook/lib/python3.11/site-packages (from matplotlib->cmocean) (2.8.2)
Requirement already satisfied: six>=1.5 in /srv/conda/envs/notebook/lib/python3.11/site-packages (from python-dateutil>=2.7->matplotlib->cmocean) (1.16.0)
Using cached cmocean-4.0.3-py3-none-any.whl (421 kB)
Installing collected packages: cmocean
Successfully installed cmocean-4.0.3
Note: you may need to restart the kernel to use updated packages.
import numpy as np

import xarray as xr
import hvplot.xarray

import cartopy.crs as ccrs
import cartopy.feature as cfeature

import matplotlib.pyplot as plt
from matplotlib.colors import LogNorm, BoundaryNorm
import cmocean
ds = xr.open_zarr("~/shared/mind_the_chl_gap/IO.zarr")
ds
<xarray.Dataset> Size: 66GB
Dimensions:                       (time: 16071, lat: 177, lon: 241)
Coordinates:
  * lat                           (lat) float32 708B 32.0 31.75 ... -11.75 -12.0
  * lon                           (lon) float32 964B 42.0 42.25 ... 101.8 102.0
  * time                          (time) datetime64[ns] 129kB 1979-01-01 ... ...
Data variables: (12/27)
    CHL                           (time, lat, lon) float32 3GB dask.array<chunksize=(100, 177, 241), meta=np.ndarray>
    CHL_cmes-cloud                (time, lat, lon) uint8 686MB dask.array<chunksize=(100, 177, 241), meta=np.ndarray>
    CHL_cmes-gapfree              (time, lat, lon) float32 3GB dask.array<chunksize=(100, 177, 241), meta=np.ndarray>
    CHL_cmes-land                 (lat, lon) uint8 43kB dask.array<chunksize=(177, 241), meta=np.ndarray>
    CHL_cmes-level3               (time, lat, lon) float32 3GB dask.array<chunksize=(100, 177, 241), meta=np.ndarray>
    CHL_cmes_flags-gapfree        (time, lat, lon) float32 3GB dask.array<chunksize=(100, 177, 241), meta=np.ndarray>
    ...                            ...
    ug_curr                       (time, lat, lon) float32 3GB dask.array<chunksize=(100, 177, 241), meta=np.ndarray>
    v_curr                        (time, lat, lon) float32 3GB dask.array<chunksize=(100, 177, 241), meta=np.ndarray>
    v_wind                        (time, lat, lon) float32 3GB dask.array<chunksize=(100, 177, 241), meta=np.ndarray>
    vg_curr                       (time, lat, lon) float32 3GB dask.array<chunksize=(100, 177, 241), meta=np.ndarray>
    wind_dir                      (time, lat, lon) float32 3GB dask.array<chunksize=(100, 177, 241), meta=np.ndarray>
    wind_speed                    (time, lat, lon) float32 3GB dask.array<chunksize=(100, 177, 241), meta=np.ndarray>
Attributes: (12/92)
    Conventions:                     CF-1.8, ACDD-1.3
    DPM_reference:                   GC-UD-ACRI-PUG
    IODD_reference:                  GC-UD-ACRI-PUG
    acknowledgement:                 The Licensees will ensure that original ...
    citation:                        The Licensees will ensure that original ...
    cmems_product_id:                OCEANCOLOUR_GLO_BGC_L3_MY_009_103
    ...                              ...
    time_coverage_end:               2024-04-18T02:58:23Z
    time_coverage_resolution:        P1D
    time_coverage_start:             2024-04-16T21:12:05Z
    title:                           cmems_obs-oc_glo_bgc-plankton_my_l3-mult...
    westernmost_longitude:           -180.0
    westernmost_valid_longitude:     -180.0
xarray.Dataset
- time: 16071
- lat: 177
- lon: 241
- lat(lat)float3232.0 31.75 31.5 ... -11.75 -12.0
- long_name :
- latitude
- standard_name :
- latitude
- units :
- degrees_north
array([ 32. , 31.75, 31.5 , 31.25, 31. , 30.75, 30.5 , 30.25, 30. , 29.75, 29.5 , 29.25, 29. , 28.75, 28.5 , 28.25, 28. , 27.75, 27.5 , 27.25, 27. , 26.75, 26.5 , 26.25, 26. , 25.75, 25.5 , 25.25, 25. , 24.75, 24.5 , 24.25, 24. , 23.75, 23.5 , 23.25, 23. , 22.75, 22.5 , 22.25, 22. , 21.75, 21.5 , 21.25, 21. , 20.75, 20.5 , 20.25, 20. , 19.75, 19.5 , 19.25, 19. , 18.75, 18.5 , 18.25, 18. , 17.75, 17.5 , 17.25, 17. , 16.75, 16.5 , 16.25, 16. , 15.75, 15.5 , 15.25, 15. , 14.75, 14.5 , 14.25, 14. , 13.75, 13.5 , 13.25, 13. , 12.75, 12.5 , 12.25, 12. , 11.75, 11.5 , 11.25, 11. , 10.75, 10.5 , 10.25, 10. , 9.75, 9.5 , 9.25, 9. , 8.75, 8.5 , 8.25, 8. , 7.75, 7.5 , 7.25, 7. , 6.75, 6.5 , 6.25, 6. , 5.75, 5.5 , 5.25, 5. , 4.75, 4.5 , 4.25, 4. , 3.75, 3.5 , 3.25, 3. , 2.75, 2.5 , 2.25, 2. , 1.75, 1.5 , 1.25, 1. , 0.75, 0.5 , 0.25, 0. , -0.25, -0.5 , -0.75, -1. , -1.25, -1.5 , -1.75, -2. , -2.25, -2.5 , -2.75, -3. , -3.25, -3.5 , -3.75, -4. , -4.25, -4.5 , -4.75, -5. , -5.25, -5.5 , -5.75, -6. , -6.25, -6.5 , -6.75, -7. , -7.25, -7.5 , -7.75, -8. , -8.25, -8.5 , -8.75, -9. , -9.25, -9.5 , -9.75, -10. , -10.25, -10.5 , -10.75, -11. , -11.25, -11.5 , -11.75, -12. ], dtype=float32) - lon(lon)float3242.0 42.25 42.5 ... 101.8 102.0
- long_name :
- longitude
- standard_name :
- longitude
- units :
- degrees_east
array([ 42. , 42.25, 42.5 , ..., 101.5 , 101.75, 102. ], dtype=float32)
- time(time)datetime64[ns]1979-01-01 ... 2022-12-31
- axis :
- T
- comment :
- Data is averaged over the day
- long_name :
- time centered on the day
- standard_name :
- time
- time_bounds :
- 2000-01-01 00:00:00 to 2000-01-01 23:59:59
array(['1979-01-01T00:00:00.000000000', '1979-01-02T00:00:00.000000000',
       '1979-01-03T00:00:00.000000000', ..., '2022-12-29T00:00:00.000000000',
       '2022-12-30T00:00:00.000000000', '2022-12-31T00:00:00.000000000'],
      dtype='datetime64[ns]')
- CHL(time, lat, lon)float32dask.array<chunksize=(100, 177, 241), meta=np.ndarray>
- _ChunkSizes :
- [1, 256, 256]
- ancillary_variables :
- flags CHL_uncertainty
- coverage_content_type :
- modelResult
- input_files_reprocessings :
- Processors versions: MODIS R2022.0NRT/VIIRSN R2022.0NRT/OLCIA 07.02/VIIRSJ1 R2022.0NRT/OLCIB 07.02
- long_name :
- Chlorophyll-a concentration - Mean of the binned pixels
- standard_name :
- mass_concentration_of_chlorophyll_a_in_sea_water
- type :
- surface
- units :
- milligram m-3
- valid_max :
- 1000.0
- valid_min :
- 0.0
Array Chunk Bytes 2.55 GiB 16.27 MiB Shape (16071, 177, 241) (100, 177, 241) Dask graph 161 chunks in 2 graph layers Data type float32 numpy.ndarray - CHL_cmes-cloud(time, lat, lon)uint8dask.array<chunksize=(100, 177, 241), meta=np.ndarray>
- title :
- flag for CHL-gapfree and CHL-level3. 0 is land; 1 is cloud; 0 is water
Array Chunk Bytes 653.78 MiB 4.07 MiB Shape (16071, 177, 241) (100, 177, 241) Dask graph 161 chunks in 2 graph layers Data type uint8 numpy.ndarray - CHL_cmes-gapfree(time, lat, lon)float32dask.array<chunksize=(100, 177, 241), meta=np.ndarray>
- Conventions :
- CF-1.8, ACDD-1.3
- DPM_reference :
- GC-UD-ACRI-PUG
- IODD_reference :
- GC-UD-ACRI-PUG
- acknowledgement :
- The Licensees will ensure that original CMEMS products - or value added products or derivative works developed from CMEMS Products including publications and pictures - shall credit CMEMS by explicitly making mention of the originator (CMEMS) in the following manner: <Generated using CMEMS Products, production centre ACRI-ST>
- ancillary_variables :
- flags CHL_uncertainty
- citation :
- The Licensees will ensure that original CMEMS products - or value added products or derivative works developed from CMEMS Products including publications and pictures - shall credit CMEMS by explicitly making mention of the originator (CMEMS) in the following manner: <Generated using CMEMS Products, production centre ACRI-ST>
- cmems_product_id :
- OCEANCOLOUR_GLO_BGC_L4_MY_009_104
- cmems_production_unit :
- OC-ACRI-NICE-FR
- comment :
- average
- contact :
- servicedesk.cmems@acri-st.fr
- copernicusmarine_version :
- 1.3.1
- coverage_content_type :
- modelResult
- creation_date :
- 2023-11-29 UTC
- creation_time :
- 01:06:50 UTC
- creator_email :
- servicedesk.cmems@acri-st.fr
- creator_name :
- ACRI
- creator_url :
- http://marine.copernicus.eu
- date_created :
- 2023-11-29T01:06:50Z
- distribution_statement :
- See CMEMS Data License
- duration_time :
- PT146878S
- earth_radius :
- 6378.137
- easternmost_longitude :
- 180.0
- easternmost_valid_longitude :
- 180.00001525878906
- file_quality_index :
- 0
- geospatial_bounds :
- POLYGON ((90.000000 -180.000000, 90.000000 180.000000, -90.000000 180.000000, -90.000000 -180.000000, 90.000000 -180.000000))
- geospatial_bounds_crs :
- EPSG:4326
- geospatial_bounds_vertical_crs :
- EPSG:5829
- geospatial_lat_max :
- 89.97916412353516
- geospatial_lat_min :
- -89.97917175292969
- geospatial_lon_max :
- 179.9791717529297
- geospatial_lon_min :
- -179.9791717529297
- geospatial_vertical_max :
- 0
- geospatial_vertical_min :
- 0
- geospatial_vertical_positive :
- up
- grid_mapping :
- Equirectangular
- grid_resolution :
- 4.638312339782715
- history :
- Created using software developed at ACRI-ST
- id :
- 20231121_cmems_obs-oc_glo_bgc-plankton_myint_l4-gapfree-multi-4km_P1D
- input_files_reprocessings :
- Processors versions: MODIS R2022.0NRT/VIIRSN R2022.0.1NRT/OLCIA 07.02/VIIRSJ1 R2022.0NRT/OLCIB 07.02
- institution :
- ACRI
- keywords :
- EARTH SCIENCE > OCEANS > OCEAN CHEMISTRY > CHLOROPHYLL
- keywords_vocabulary :
- NASA Global Change Master Directory (GCMD) Science Keywords
- lat_step :
- 0.0416666679084301
- license :
- See CMEMS Data License
- lon_step :
- 0.0416666679084301
- long_name :
- Chlorophyll-a concentration - Mean of the binned pixels
- naming_authority :
- CMEMS
- nb_bins :
- 37324800
- nb_equ_bins :
- 8640
- nb_grid_bins :
- 37324800
- nb_valid_bins :
- 19169208
- netcdf_version_id :
- 4.3.3.1 of Jul 8 2016 18:15:50 $
- northernmost_latitude :
- 90.0
- northernmost_valid_latitude :
- 58.08333206176758
- overall_quality :
- mode=myint
- parameter :
- Chlorophyll-a concentration
- parameter_code :
- CHL
- pct_bins :
- 100.0
- pct_valid_bins :
- 51.357831790123456
- period_duration_day :
- P1D
- period_end_day :
- 20231121
- period_start_day :
- 20231121
- platform :
- Aqua,Suomi-NPP,Sentinel-3a,JPSS-1 (NOAA-20),Sentinel-3b
- processing_level :
- L4
- product_level :
- 4
- product_name :
- 20231121_cmems_obs-oc_glo_bgc-plankton_myint_l4-gapfree-multi-4km_P1D
- product_type :
- day
- project :
- CMEMS
- publication :
- Gohin, F., Druon, J. N., Lampert, L. (2002). A five channel chlorophyll concentration algorithm applied to SeaWiFS data processed by SeaDAS in coastal waters. International journal of remote sensing, 23(8), 1639-1661 + Hu, C., Lee, Z., Franz, B. (2012). Chlorophyll a algorithms for oligotrophic oceans: A novel approach based on three-band reflectance difference. Journal of Geophysical Research, 117(C1). doi: 10.1029/2011jc007395
- publisher_email :
- servicedesk.cmems@mercator-ocean.eu
- publisher_name :
- CMEMS
- publisher_url :
- http://marine.copernicus.eu
- references :
- http://www.globcolour.info GlobColour has been originally funded by ESA with data from ESA, NASA, NOAA and GeoEye. This version has received funding from the European Community s Seventh Framework Programme ([FP7/2007-2013]) under grant agreement n. 282723 [OSS2015 project].
- registration :
- 5
- sensor :
- Moderate Resolution Imaging Spectroradiometer,Visible Infrared Imaging Radiometer Suite,Ocean and Land Colour Instrument
- sensor_name :
- MODISA,VIIRSN,OLCIa,VIIRSJ1,OLCIb
- sensor_name_list :
- MOD,VIR,OLA,VJ1,OLB
- site_name :
- GLO
- software_name :
- globcolour_l3_reproject
- software_version :
- 2022.2
- source :
- surface observation
- southernmost_latitude :
- -90.0
- southernmost_valid_latitude :
- -78.58333587646484
- standard_name :
- mass_concentration_of_chlorophyll_a_in_sea_water
- standard_name_vocabulary :
- NetCDF Climate and Forecast (CF) Metadata Convention
- start_date :
- 2023-11-20 UTC
- start_time :
- 15:24:55 UTC
- stop_date :
- 2023-11-22 UTC
- stop_time :
- 08:12:52 UTC
- summary :
- CMEMS product: cmems_obs-oc_glo_bgc-plankton_my_l4-gapfree-multi-4km_P1D, generated by ACRI-ST
- time_coverage_duration :
- PT146878S
- time_coverage_end :
- 2023-11-22T08:12:52Z
- time_coverage_resolution :
- P1D
- time_coverage_start :
- 2023-11-20T15:24:55Z
- title :
- cmems_obs-oc_glo_bgc-plankton_my_l4-gapfree-multi-4km_P1D
- type :
- surface
- units :
- milligram m-3
- valid_max :
- 1000.0
- valid_min :
- 0.0
- westernmost_longitude :
- -180.0
- westernmost_valid_longitude :
- -180.0
Array Chunk Bytes 2.55 GiB 16.27 MiB Shape (16071, 177, 241) (100, 177, 241) Dask graph 161 chunks in 2 graph layers Data type float32 numpy.ndarray - CHL_cmes-land(lat, lon)uint8dask.array<chunksize=(177, 241), meta=np.ndarray>
Array Chunk Bytes 41.66 kiB 41.66 kiB Shape (177, 241) (177, 241) Dask graph 1 chunks in 2 graph layers Data type uint8 numpy.ndarray - CHL_cmes-level3(time, lat, lon)float32dask.array<chunksize=(100, 177, 241), meta=np.ndarray>
- Conventions :
- CF-1.8, ACDD-1.3
- DPM_reference :
- GC-UD-ACRI-PUG
- IODD_reference :
- GC-UD-ACRI-PUG
- acknowledgement :
- The Licensees will ensure that original CMEMS products - or value added products or derivative works developed from CMEMS Products including publications and pictures - shall credit CMEMS by explicitly making mention of the originator (CMEMS) in the following manner: <Generated using CMEMS Products, production centre ACRI-ST>
- ancillary_variables :
- flags CHL_uncertainty
- citation :
- The Licensees will ensure that original CMEMS products - or value added products or derivative works developed from CMEMS Products including publications and pictures - shall credit CMEMS by explicitly making mention of the originator (CMEMS) in the following manner: <Generated using CMEMS Products, production centre ACRI-ST>
- cmems_product_id :
- OCEANCOLOUR_GLO_BGC_L3_MY_009_103
- cmems_production_unit :
- OC-ACRI-NICE-FR
- comment :
- average
- contact :
- servicedesk.cmems@acri-st.fr
- copernicusmarine_version :
- 1.3.1
- coverage_content_type :
- modelResult
- creation_date :
- 2024-04-25 UTC
- creation_time :
- 00:47:33 UTC
- creator_email :
- servicedesk.cmems@acri-st.fr
- creator_name :
- ACRI
- creator_url :
- http://marine.copernicus.eu
- date_created :
- 2024-04-25T00:47:33Z
- distribution_statement :
- See CMEMS Data License
- duration_time :
- PT107179S
- earth_radius :
- 6378.137
- easternmost_longitude :
- 180.0
- easternmost_valid_longitude :
- 180.00001525878906
- file_quality_index :
- 0
- geospatial_bounds :
- POLYGON ((90.000000 -180.000000, 90.000000 180.000000, -90.000000 180.000000, -90.000000 -180.000000, 90.000000 -180.000000))
- geospatial_bounds_crs :
- EPSG:4326
- geospatial_bounds_vertical_crs :
- EPSG:5829
- geospatial_lat_max :
- 89.97916412353516
- geospatial_lat_min :
- -89.97917175292969
- geospatial_lon_max :
- 179.9791717529297
- geospatial_lon_min :
- -179.9791717529297
- geospatial_vertical_max :
- 0
- geospatial_vertical_min :
- 0
- geospatial_vertical_positive :
- up
- grid_mapping :
- Equirectangular
- grid_resolution :
- 4.638312339782715
- history :
- Created using software developed at ACRI-ST
- id :
- 20240417_cmems_obs-oc_glo_bgc-plankton_myint_l3-multi-4km_P1D
- input_files_reprocessings :
- Processors versions: MODIS R2022.0NRT/VIIRSN R2022.0.1NRT/OLCIA 07.04/VIIRSJ1 R2022.0NRT/OLCIB 07.04
- institution :
- ACRI
- keywords :
- EARTH SCIENCE > OCEANS > OCEAN CHEMISTRY > CHLOROPHYLL, EARTH SCIENCE > BIOLOGICAL CLASSIFICATION > PROTISTS > PLANKTON > PHYTOPLANKTON
- keywords_vocabulary :
- NASA Global Change Master Directory (GCMD) Science Keywords
- lat_step :
- 0.0416666679084301
- license :
- See CMEMS Data License
- lon_step :
- 0.0416666679084301
- long_name :
- Chlorophyll-a concentration - Mean of the binned pixels
- naming_authority :
- CMEMS
- nb_bins :
- 37324800
- nb_equ_bins :
- 8640
- nb_grid_bins :
- 37324800
- nb_valid_bins :
- 9704694
- netcdf_version_id :
- 4.3.3.1 of Jul 8 2016 18:15:50 $
- northernmost_latitude :
- 90.0
- northernmost_valid_latitude :
- 82.70833587646484
- overall_quality :
- mode=myint
- parameter :
- Chlorophyll-a concentration,Phytoplankton Functional Types
- parameter_code :
- CHL,DIATO,DINO,HAPTO,GREEN,PROKAR,PROCHLO,MICRO,NANO,PICO
- pct_bins :
- 100.0
- pct_valid_bins :
- 26.000659079218106
- period_duration_day :
- P1D
- period_end_day :
- 20240417
- period_start_day :
- 20240417
- platform :
- Aqua,Suomi-NPP,Sentinel-3a,JPSS-1 (NOAA-20),Sentinel-3b
- processing_level :
- L3
- product_level :
- 3
- product_name :
- 20240417_cmems_obs-oc_glo_bgc-plankton_myint_l3-multi-4km_P1D
- product_type :
- day
- project :
- CMEMS
- publication :
- Gohin, F., Druon, J. N., Lampert, L. (2002). A five channel chlorophyll concentration algorithm applied to SeaWiFS data processed by SeaDAS in coastal waters. International journal of remote sensing, 23(8), 1639-1661 + Hu, C., Lee, Z., Franz, B. (2012). Chlorophyll a algorithms for oligotrophic oceans: A novel approach based on three-band reflectance difference. Journal of Geophysical Research, 117(C1). doi: 10.1029/2011jc007395 + Xi H, Losa S N, Mangin A, Garnesson P, Bretagnon M, Demaria J, Soppa M A, Hembise Fanton d Andon O, Bracher A (2021) Global chlorophyll a concentrations of phytoplankton functional types with detailed uncertainty assessment using multi-sensor ocean color and sea surface temperature satellite products, JGR, in review.
- publisher_email :
- servicedesk.cmems@mercator-ocean.eu
- publisher_name :
- CMEMS
- publisher_url :
- http://marine.copernicus.eu
- references :
- http://www.globcolour.info GlobColour has been originally funded by ESA with data from ESA, NASA, NOAA and GeoEye. This version has received funding from the European Community s Seventh Framework Programme ([FP7/2007-2013]) under grant agreement n. 282723 [OSS2015 project].
- registration :
- 5
- sensor :
- Moderate Resolution Imaging Spectroradiometer,Visible Infrared Imaging Radiometer Suite,Ocean and Land Colour Instrument
- sensor_name :
- MODISA,VIIRSN,OLCIa,VIIRSJ1,OLCIb
- sensor_name_list :
- MOD,VIR,OLA,VJ1,OLB
- site_name :
- GLO
- software_name :
- globcolour_l3_reproject
- software_version :
- 2022.2
- source :
- surface observation
- southernmost_latitude :
- -90.0
- southernmost_valid_latitude :
- -66.33333587646484
- standard_name :
- mass_concentration_of_chlorophyll_a_in_sea_water
- standard_name_vocabulary :
- NetCDF Climate and Forecast (CF) Metadata Convention
- start_date :
- 2024-04-16 UTC
- start_time :
- 21:12:05 UTC
- stop_date :
- 2024-04-18 UTC
- stop_time :
- 02:58:23 UTC
- summary :
- CMEMS product: cmems_obs-oc_glo_bgc-plankton_my_l3-multi-4km_P1D, generated by ACRI-ST
- time_coverage_duration :
- PT107179S
- time_coverage_end :
- 2024-04-18T02:58:23Z
- time_coverage_resolution :
- P1D
- time_coverage_start :
- 2024-04-16T21:12:05Z
- title :
- cmems_obs-oc_glo_bgc-plankton_my_l3-multi-4km_P1D
- type :
- surface
- units :
- milligram m-3
- valid_max :
- 1000.0
- valid_min :
- 0.0
- westernmost_longitude :
- -180.0
- westernmost_valid_longitude :
- -180.0
Array Chunk Bytes 2.55 GiB 16.27 MiB Shape (16071, 177, 241) (100, 177, 241) Dask graph 161 chunks in 2 graph layers Data type float32 numpy.ndarray - CHL_cmes_flags-gapfree(time, lat, lon)float32dask.array<chunksize=(100, 177, 241), meta=np.ndarray>
- Conventions :
- CF-1.8, ACDD-1.3
- DPM_reference :
- GC-UD-ACRI-PUG
- IODD_reference :
- GC-UD-ACRI-PUG
- acknowledgement :
- The Licensees will ensure that original CMEMS products - or value added products or derivative works developed from CMEMS Products including publications and pictures - shall credit CMEMS by explicitly making mention of the originator (CMEMS) in the following manner: <Generated using CMEMS Products, production centre ACRI-ST>
- citation :
- The Licensees will ensure that original CMEMS products - or value added products or derivative works developed from CMEMS Products including publications and pictures - shall credit CMEMS by explicitly making mention of the originator (CMEMS) in the following manner: <Generated using CMEMS Products, production centre ACRI-ST>
- cmems_product_id :
- OCEANCOLOUR_GLO_BGC_L4_MY_009_104
- cmems_production_unit :
- OC-ACRI-NICE-FR
- comment :
- average
- contact :
- servicedesk.cmems@acri-st.fr
- copernicusmarine_version :
- 1.3.1
- coverage_content_type :
- auxiliaryInformation
- creation_date :
- 2023-11-29 UTC
- creation_time :
- 01:06:50 UTC
- creator_email :
- servicedesk.cmems@acri-st.fr
- creator_name :
- ACRI
- creator_url :
- http://marine.copernicus.eu
- date_created :
- 2023-11-29T01:06:50Z
- distribution_statement :
- See CMEMS Data License
- duration_time :
- PT146878S
- earth_radius :
- 6378.137
- easternmost_longitude :
- 180.0
- easternmost_valid_longitude :
- 180.00001525878906
- file_quality_index :
- 0
- flag_masks :
- [1, 2]
- flag_meanings :
- LAND INTERPOLATED
- geospatial_bounds :
- POLYGON ((90.000000 -180.000000, 90.000000 180.000000, -90.000000 180.000000, -90.000000 -180.000000, 90.000000 -180.000000))
- geospatial_bounds_crs :
- EPSG:4326
- geospatial_bounds_vertical_crs :
- EPSG:5829
- geospatial_lat_max :
- 89.97916412353516
- geospatial_lat_min :
- -89.97917175292969
- geospatial_lon_max :
- 179.9791717529297
- geospatial_lon_min :
- -179.9791717529297
- geospatial_vertical_max :
- 0
- geospatial_vertical_min :
- 0
- geospatial_vertical_positive :
- up
- grid_mapping :
- Equirectangular
- grid_resolution :
- 4.638312339782715
- history :
- Created using software developed at ACRI-ST
- id :
- 20231121_cmems_obs-oc_glo_bgc-plankton_myint_l4-gapfree-multi-4km_P1D
- institution :
- ACRI
- keywords :
- EARTH SCIENCE > OCEANS > OCEAN CHEMISTRY > CHLOROPHYLL
- keywords_vocabulary :
- NASA Global Change Master Directory (GCMD) Science Keywords
- lat_step :
- 0.0416666679084301
- license :
- See CMEMS Data License
- lon_step :
- 0.0416666679084301
- long_name :
- Flags
- naming_authority :
- CMEMS
- nb_bins :
- 37324800
- nb_equ_bins :
- 8640
- nb_grid_bins :
- 37324800
- nb_valid_bins :
- 19169208
- netcdf_version_id :
- 4.3.3.1 of Jul 8 2016 18:15:50 $
- northernmost_latitude :
- 90.0
- northernmost_valid_latitude :
- 58.08333206176758
- overall_quality :
- mode=myint
- parameter :
- Chlorophyll-a concentration
- parameter_code :
- CHL
- pct_bins :
- 100.0
- pct_valid_bins :
- 51.357831790123456
- period_duration_day :
- P1D
- period_end_day :
- 20231121
- period_start_day :
- 20231121
- platform :
- Aqua,Suomi-NPP,Sentinel-3a,JPSS-1 (NOAA-20),Sentinel-3b
- processing_level :
- L4
- product_level :
- 4
- product_name :
- 20231121_cmems_obs-oc_glo_bgc-plankton_myint_l4-gapfree-multi-4km_P1D
- product_type :
- day
- project :
- CMEMS
- publication :
- Gohin, F., Druon, J. N., Lampert, L. (2002). A five channel chlorophyll concentration algorithm applied to SeaWiFS data processed by SeaDAS in coastal waters. International journal of remote sensing, 23(8), 1639-1661 + Hu, C., Lee, Z., Franz, B. (2012). Chlorophyll a algorithms for oligotrophic oceans: A novel approach based on three-band reflectance difference. Journal of Geophysical Research, 117(C1). doi: 10.1029/2011jc007395
- publisher_email :
- servicedesk.cmems@mercator-ocean.eu
- publisher_name :
- CMEMS
- publisher_url :
- http://marine.copernicus.eu
- references :
- http://www.globcolour.info GlobColour has been originally funded by ESA with data from ESA, NASA, NOAA and GeoEye. This version has received funding from the European Community s Seventh Framework Programme ([FP7/2007-2013]) under grant agreement n. 282723 [OSS2015 project].
- registration :
- 5
- sensor :
- Moderate Resolution Imaging Spectroradiometer,Visible Infrared Imaging Radiometer Suite,Ocean and Land Colour Instrument
- sensor_name :
- MODISA,VIIRSN,OLCIa,VIIRSJ1,OLCIb
- sensor_name_list :
- MOD,VIR,OLA,VJ1,OLB
- site_name :
- GLO
- software_name :
- globcolour_l3_reproject
- software_version :
- 2022.2
- source :
- surface observation
- southernmost_latitude :
- -90.0
- southernmost_valid_latitude :
- -78.58333587646484
- standard_name :
- status_flag
- standard_name_vocabulary :
- NetCDF Climate and Forecast (CF) Metadata Convention
- start_date :
- 2023-11-20 UTC
- start_time :
- 15:24:55 UTC
- stop_date :
- 2023-11-22 UTC
- stop_time :
- 08:12:52 UTC
- summary :
- CMEMS product: cmems_obs-oc_glo_bgc-plankton_my_l4-gapfree-multi-4km_P1D, generated by ACRI-ST
- time_coverage_duration :
- PT146878S
- time_coverage_end :
- 2023-11-22T08:12:52Z
- time_coverage_resolution :
- P1D
- time_coverage_start :
- 2023-11-20T15:24:55Z
- title :
- cmems_obs-oc_glo_bgc-plankton_my_l4-gapfree-multi-4km_P1D
- valid_max :
- 3
- valid_min :
- 0
- westernmost_longitude :
- -180.0
- westernmost_valid_longitude :
- -180.0
Array Chunk Bytes 2.55 GiB 16.27 MiB Shape (16071, 177, 241) (100, 177, 241) Dask graph 161 chunks in 2 graph layers Data type float32 numpy.ndarray - CHL_cmes_flags-level3(time, lat, lon)float32dask.array<chunksize=(100, 177, 241), meta=np.ndarray>
- Conventions :
- CF-1.8, ACDD-1.3
- DPM_reference :
- GC-UD-ACRI-PUG
- IODD_reference :
- GC-UD-ACRI-PUG
- acknowledgement :
- The Licensees will ensure that original CMEMS products - or value added products or derivative works developed from CMEMS Products including publications and pictures - shall credit CMEMS by explicitly making mention of the originator (CMEMS) in the following manner: <Generated using CMEMS Products, production centre ACRI-ST>
- citation :
- The Licensees will ensure that original CMEMS products - or value added products or derivative works developed from CMEMS Products including publications and pictures - shall credit CMEMS by explicitly making mention of the originator (CMEMS) in the following manner: <Generated using CMEMS Products, production centre ACRI-ST>
- cmems_product_id :
- OCEANCOLOUR_GLO_BGC_L3_MY_009_103
- cmems_production_unit :
- OC-ACRI-NICE-FR
- comment :
- average
- contact :
- servicedesk.cmems@acri-st.fr
- copernicusmarine_version :
- 1.3.1
- coverage_content_type :
- auxiliaryInformation
- creation_date :
- 2024-04-25 UTC
- creation_time :
- 00:47:33 UTC
- creator_email :
- servicedesk.cmems@acri-st.fr
- creator_name :
- ACRI
- creator_url :
- http://marine.copernicus.eu
- date_created :
- 2024-04-25T00:47:33Z
- distribution_statement :
- See CMEMS Data License
- duration_time :
- PT107179S
- earth_radius :
- 6378.137
- easternmost_longitude :
- 180.0
- easternmost_valid_longitude :
- 180.00001525878906
- file_quality_index :
- 0
- flag_masks :
- 1
- flag_meanings :
- LAND
- geospatial_bounds :
- POLYGON ((90.000000 -180.000000, 90.000000 180.000000, -90.000000 180.000000, -90.000000 -180.000000, 90.000000 -180.000000))
- geospatial_bounds_crs :
- EPSG:4326
- geospatial_bounds_vertical_crs :
- EPSG:5829
- geospatial_lat_max :
- 89.97916412353516
- geospatial_lat_min :
- -89.97917175292969
- geospatial_lon_max :
- 179.9791717529297
- geospatial_lon_min :
- -179.9791717529297
- geospatial_vertical_max :
- 0
- geospatial_vertical_min :
- 0
- geospatial_vertical_positive :
- up
- grid_mapping :
- Equirectangular
- grid_resolution :
- 4.638312339782715
- history :
- Created using software developed at ACRI-ST
- id :
- 20240417_cmems_obs-oc_glo_bgc-plankton_myint_l3-multi-4km_P1D
- institution :
- ACRI
- keywords :
- EARTH SCIENCE > OCEANS > OCEAN CHEMISTRY > CHLOROPHYLL, EARTH SCIENCE > BIOLOGICAL CLASSIFICATION > PROTISTS > PLANKTON > PHYTOPLANKTON
- keywords_vocabulary :
- NASA Global Change Master Directory (GCMD) Science Keywords
- lat_step :
- 0.0416666679084301
- license :
- See CMEMS Data License
- lon_step :
- 0.0416666679084301
- long_name :
- Flags
- naming_authority :
- CMEMS
- nb_bins :
- 37324800
- nb_equ_bins :
- 8640
- nb_grid_bins :
- 37324800
- nb_valid_bins :
- 9704694
- netcdf_version_id :
- 4.3.3.1 of Jul 8 2016 18:15:50 $
- northernmost_latitude :
- 90.0
- northernmost_valid_latitude :
- 82.70833587646484
- overall_quality :
- mode=myint
- parameter :
- Chlorophyll-a concentration,Phytoplankton Functional Types
- parameter_code :
- CHL,DIATO,DINO,HAPTO,GREEN,PROKAR,PROCHLO,MICRO,NANO,PICO
- pct_bins :
- 100.0
- pct_valid_bins :
- 26.000659079218106
- period_duration_day :
- P1D
- period_end_day :
- 20240417
- period_start_day :
- 20240417
- platform :
- Aqua,Suomi-NPP,Sentinel-3a,JPSS-1 (NOAA-20),Sentinel-3b
- processing_level :
- L3
- product_level :
- 3
- product_name :
- 20240417_cmems_obs-oc_glo_bgc-plankton_myint_l3-multi-4km_P1D
- product_type :
- day
- project :
- CMEMS
- publication :
- Gohin, F., Druon, J. N., Lampert, L. (2002). A five channel chlorophyll concentration algorithm applied to SeaWiFS data processed by SeaDAS in coastal waters. International journal of remote sensing, 23(8), 1639-1661 + Hu, C., Lee, Z., Franz, B. (2012). Chlorophyll a algorithms for oligotrophic oceans: A novel approach based on three-band reflectance difference. Journal of Geophysical Research, 117(C1). doi: 10.1029/2011jc007395 + Xi H, Losa S N, Mangin A, Garnesson P, Bretagnon M, Demaria J, Soppa M A, Hembise Fanton d Andon O, Bracher A (2021) Global chlorophyll a concentrations of phytoplankton functional types with detailed uncertainty assessment using multi-sensor ocean color and sea surface temperature satellite products, JGR, in review.
- publisher_email :
- servicedesk.cmems@mercator-ocean.eu
- publisher_name :
- CMEMS
- publisher_url :
- http://marine.copernicus.eu
- references :
- http://www.globcolour.info GlobColour has been originally funded by ESA with data from ESA, NASA, NOAA and GeoEye. This version has received funding from the European Community s Seventh Framework Programme ([FP7/2007-2013]) under grant agreement n. 282723 [OSS2015 project].
- registration :
- 5
- sensor :
- Moderate Resolution Imaging Spectroradiometer,Visible Infrared Imaging Radiometer Suite,Ocean and Land Colour Instrument
- sensor_name :
- MODISA,VIIRSN,OLCIa,VIIRSJ1,OLCIb
- sensor_name_list :
- MOD,VIR,OLA,VJ1,OLB
- site_name :
- GLO
- software_name :
- globcolour_l3_reproject
- software_version :
- 2022.2
- source :
- surface observation
- southernmost_latitude :
- -90.0
- southernmost_valid_latitude :
- -66.33333587646484
- standard_name :
- status_flag
- standard_name_vocabulary :
- NetCDF Climate and Forecast (CF) Metadata Convention
- start_date :
- 2024-04-16 UTC
- start_time :
- 21:12:05 UTC
- stop_date :
- 2024-04-18 UTC
- stop_time :
- 02:58:23 UTC
- summary :
- CMEMS product: cmems_obs-oc_glo_bgc-plankton_my_l3-multi-4km_P1D, generated by ACRI-ST
- time_coverage_duration :
- PT107179S
- time_coverage_end :
- 2024-04-18T02:58:23Z
- time_coverage_resolution :
- P1D
- time_coverage_start :
- 2024-04-16T21:12:05Z
- title :
- cmems_obs-oc_glo_bgc-plankton_my_l3-multi-4km_P1D
- valid_max :
- 1
- valid_min :
- 0
- westernmost_longitude :
- -180.0
- westernmost_valid_longitude :
- -180.0
Array Chunk Bytes 2.55 GiB 16.27 MiB Shape (16071, 177, 241) (100, 177, 241) Dask graph 161 chunks in 2 graph layers Data type float32 numpy.ndarray - CHL_cmes_uncertainty-gapfree(time, lat, lon)float32dask.array<chunksize=(100, 177, 241), meta=np.ndarray>
- Conventions :
- CF-1.8, ACDD-1.3
- DPM_reference :
- GC-UD-ACRI-PUG
- IODD_reference :
- GC-UD-ACRI-PUG
- acknowledgement :
- The Licensees will ensure that original CMEMS products - or value added products or derivative works developed from CMEMS Products including publications and pictures - shall credit CMEMS by explicitly making mention of the originator (CMEMS) in the following manner: <Generated using CMEMS Products, production centre ACRI-ST>
- citation :
- The Licensees will ensure that original CMEMS products - or value added products or derivative works developed from CMEMS Products including publications and pictures - shall credit CMEMS by explicitly making mention of the originator (CMEMS) in the following manner: <Generated using CMEMS Products, production centre ACRI-ST>
- cmems_product_id :
- OCEANCOLOUR_GLO_BGC_L4_MY_009_104
- cmems_production_unit :
- OC-ACRI-NICE-FR
- comment :
- average
- contact :
- servicedesk.cmems@acri-st.fr
- copernicusmarine_version :
- 1.3.1
- coverage_content_type :
- qualityInformation
- creation_date :
- 2023-11-29 UTC
- creation_time :
- 01:06:50 UTC
- creator_email :
- servicedesk.cmems@acri-st.fr
- creator_name :
- ACRI
- creator_url :
- http://marine.copernicus.eu
- date_created :
- 2023-11-29T01:06:50Z
- distribution_statement :
- See CMEMS Data License
- duration_time :
- PT146878S
- earth_radius :
- 6378.137
- easternmost_longitude :
- 180.0
- easternmost_valid_longitude :
- 180.00001525878906
- file_quality_index :
- 0
- geospatial_bounds :
- POLYGON ((90.000000 -180.000000, 90.000000 180.000000, -90.000000 180.000000, -90.000000 -180.000000, 90.000000 -180.000000))
- geospatial_bounds_crs :
- EPSG:4326
- geospatial_bounds_vertical_crs :
- EPSG:5829
- geospatial_lat_max :
- 89.97916412353516
- geospatial_lat_min :
- -89.97917175292969
- geospatial_lon_max :
- 179.9791717529297
- geospatial_lon_min :
- -179.9791717529297
- geospatial_vertical_max :
- 0
- geospatial_vertical_min :
- 0
- geospatial_vertical_positive :
- up
- grid_mapping :
- Equirectangular
- grid_resolution :
- 4.638312339782715
- history :
- Created using software developed at ACRI-ST
- id :
- 20231121_cmems_obs-oc_glo_bgc-plankton_myint_l4-gapfree-multi-4km_P1D
- institution :
- ACRI
- keywords :
- EARTH SCIENCE > OCEANS > OCEAN CHEMISTRY > CHLOROPHYLL
- keywords_vocabulary :
- NASA Global Change Master Directory (GCMD) Science Keywords
- lat_step :
- 0.0416666679084301
- license :
- See CMEMS Data License
- lon_step :
- 0.0416666679084301
- long_name :
- Chlorophyll-a concentration - Uncertainty estimation
- naming_authority :
- CMEMS
- nb_bins :
- 37324800
- nb_equ_bins :
- 8640
- nb_grid_bins :
- 37324800
- nb_valid_bins :
- 19169208
- netcdf_version_id :
- 4.3.3.1 of Jul 8 2016 18:15:50 $
- northernmost_latitude :
- 90.0
- northernmost_valid_latitude :
- 58.08333206176758
- overall_quality :
- mode=myint
- parameter :
- Chlorophyll-a concentration
- parameter_code :
- CHL
- pct_bins :
- 100.0
- pct_valid_bins :
- 51.357831790123456
- period_duration_day :
- P1D
- period_end_day :
- 20231121
- period_start_day :
- 20231121
- platform :
- Aqua,Suomi-NPP,Sentinel-3a,JPSS-1 (NOAA-20),Sentinel-3b
- processing_level :
- L4
- product_level :
- 4
- product_name :
- 20231121_cmems_obs-oc_glo_bgc-plankton_myint_l4-gapfree-multi-4km_P1D
- product_type :
- day
- project :
- CMEMS
- publication :
- Gohin, F., Druon, J. N., Lampert, L. (2002). A five channel chlorophyll concentration algorithm applied to SeaWiFS data processed by SeaDAS in coastal waters. International journal of remote sensing, 23(8), 1639-1661 + Hu, C., Lee, Z., Franz, B. (2012). Chlorophyll a algorithms for oligotrophic oceans: A novel approach based on three-band reflectance difference. Journal of Geophysical Research, 117(C1). doi: 10.1029/2011jc007395
- publisher_email :
- servicedesk.cmems@mercator-ocean.eu
- publisher_name :
- CMEMS
- publisher_url :
- http://marine.copernicus.eu
- references :
- http://www.globcolour.info GlobColour has been originally funded by ESA with data from ESA, NASA, NOAA and GeoEye. This version has received funding from the European Community s Seventh Framework Programme ([FP7/2007-2013]) under grant agreement n. 282723 [OSS2015 project].
- registration :
- 5
- sensor :
- Moderate Resolution Imaging Spectroradiometer,Visible Infrared Imaging Radiometer Suite,Ocean and Land Colour Instrument
- sensor_name :
- MODISA,VIIRSN,OLCIa,VIIRSJ1,OLCIb
- sensor_name_list :
- MOD,VIR,OLA,VJ1,OLB
- site_name :
- GLO
- software_name :
- globcolour_l3_reproject
- software_version :
- 2022.2
- source :
- surface observation
- southernmost_latitude :
- -90.0
- southernmost_valid_latitude :
- -78.58333587646484
- standard_name_vocabulary :
- NetCDF Climate and Forecast (CF) Metadata Convention
- start_date :
- 2023-11-20 UTC
- start_time :
- 15:24:55 UTC
- stop_date :
- 2023-11-22 UTC
- stop_time :
- 08:12:52 UTC
- summary :
- CMEMS product: cmems_obs-oc_glo_bgc-plankton_my_l4-gapfree-multi-4km_P1D, generated by ACRI-ST
- time_coverage_duration :
- PT146878S
- time_coverage_end :
- 2023-11-22T08:12:52Z
- time_coverage_resolution :
- P1D
- time_coverage_start :
- 2023-11-20T15:24:55Z
- title :
- cmems_obs-oc_glo_bgc-plankton_my_l4-gapfree-multi-4km_P1D
- units :
- %
- valid_max :
- 32767
- valid_min :
- 0
- westernmost_longitude :
- -180.0
- westernmost_valid_longitude :
- -180.0
Array Chunk Bytes 2.55 GiB 16.27 MiB Shape (16071, 177, 241) (100, 177, 241) Dask graph 161 chunks in 2 graph layers Data type float32 numpy.ndarray - CHL_cmes_uncertainty-level3(time, lat, lon)float32dask.array<chunksize=(100, 177, 241), meta=np.ndarray>
- Conventions :
- CF-1.8, ACDD-1.3
- DPM_reference :
- GC-UD-ACRI-PUG
- IODD_reference :
- GC-UD-ACRI-PUG
- acknowledgement :
- The Licensees will ensure that original CMEMS products - or value added products or derivative works developed from CMEMS Products including publications and pictures - shall credit CMEMS by explicitly making mention of the originator (CMEMS) in the following manner: <Generated using CMEMS Products, production centre ACRI-ST>
- citation :
- The Licensees will ensure that original CMEMS products - or value added products or derivative works developed from CMEMS Products including publications and pictures - shall credit CMEMS by explicitly making mention of the originator (CMEMS) in the following manner: <Generated using CMEMS Products, production centre ACRI-ST>
- cmems_product_id :
- OCEANCOLOUR_GLO_BGC_L3_MY_009_103
- cmems_production_unit :
- OC-ACRI-NICE-FR
- comment :
- average
- contact :
- servicedesk.cmems@acri-st.fr
- copernicusmarine_version :
- 1.3.1
- coverage_content_type :
- qualityInformation
- creation_date :
- 2024-04-25 UTC
- creation_time :
- 00:47:33 UTC
- creator_email :
- servicedesk.cmems@acri-st.fr
- creator_name :
- ACRI
- creator_url :
- http://marine.copernicus.eu
- date_created :
- 2024-04-25T00:47:33Z
- distribution_statement :
- See CMEMS Data License
- duration_time :
- PT107179S
- earth_radius :
- 6378.137
- easternmost_longitude :
- 180.0
- easternmost_valid_longitude :
- 180.00001525878906
- file_quality_index :
- 0
- geospatial_bounds :
- POLYGON ((90.000000 -180.000000, 90.000000 180.000000, -90.000000 180.000000, -90.000000 -180.000000, 90.000000 -180.000000))
- geospatial_bounds_crs :
- EPSG:4326
- geospatial_bounds_vertical_crs :
- EPSG:5829
- geospatial_lat_max :
- 89.97916412353516
- geospatial_lat_min :
- -89.97917175292969
- geospatial_lon_max :
- 179.9791717529297
- geospatial_lon_min :
- -179.9791717529297
- geospatial_vertical_max :
- 0
- geospatial_vertical_min :
- 0
- geospatial_vertical_positive :
- up
- grid_mapping :
- Equirectangular
- grid_resolution :
- 4.638312339782715
- history :
- Created using software developed at ACRI-ST
- id :
- 20240417_cmems_obs-oc_glo_bgc-plankton_myint_l3-multi-4km_P1D
- institution :
- ACRI
- keywords :
- EARTH SCIENCE > OCEANS > OCEAN CHEMISTRY > CHLOROPHYLL, EARTH SCIENCE > BIOLOGICAL CLASSIFICATION > PROTISTS > PLANKTON > PHYTOPLANKTON
- keywords_vocabulary :
- NASA Global Change Master Directory (GCMD) Science Keywords
- lat_step :
- 0.0416666679084301
- license :
- See CMEMS Data License
- lon_step :
- 0.0416666679084301
- long_name :
- Chlorophyll-a concentration - Uncertainty estimation
- naming_authority :
- CMEMS
- nb_bins :
- 37324800
- nb_equ_bins :
- 8640
- nb_grid_bins :
- 37324800
- nb_valid_bins :
- 9704694
- netcdf_version_id :
- 4.3.3.1 of Jul 8 2016 18:15:50 $
- northernmost_latitude :
- 90.0
- northernmost_valid_latitude :
- 82.70833587646484
- overall_quality :
- mode=myint
- parameter :
- Chlorophyll-a concentration,Phytoplankton Functional Types
- parameter_code :
- CHL,DIATO,DINO,HAPTO,GREEN,PROKAR,PROCHLO,MICRO,NANO,PICO
- pct_bins :
- 100.0
- pct_valid_bins :
- 26.000659079218106
- period_duration_day :
- P1D
- period_end_day :
- 20240417
- period_start_day :
- 20240417
- platform :
- Aqua,Suomi-NPP,Sentinel-3a,JPSS-1 (NOAA-20),Sentinel-3b
- processing_level :
- L3
- product_level :
- 3
- product_name :
- 20240417_cmems_obs-oc_glo_bgc-plankton_myint_l3-multi-4km_P1D
- product_type :
- day
- project :
- CMEMS
- publication :
- Gohin, F., Druon, J. N., Lampert, L. (2002). A five channel chlorophyll concentration algorithm applied to SeaWiFS data processed by SeaDAS in coastal waters. International journal of remote sensing, 23(8), 1639-1661 + Hu, C., Lee, Z., Franz, B. (2012). Chlorophyll a algorithms for oligotrophic oceans: A novel approach based on three-band reflectance difference. Journal of Geophysical Research, 117(C1). doi: 10.1029/2011jc007395 + Xi H, Losa S N, Mangin A, Garnesson P, Bretagnon M, Demaria J, Soppa M A, Hembise Fanton d Andon O, Bracher A (2021) Global chlorophyll a concentrations of phytoplankton functional types with detailed uncertainty assessment using multi-sensor ocean color and sea surface temperature satellite products, JGR, in review.
- publisher_email :
- servicedesk.cmems@mercator-ocean.eu
- publisher_name :
- CMEMS
- publisher_url :
- http://marine.copernicus.eu
- references :
- http://www.globcolour.info GlobColour has been originally funded by ESA with data from ESA, NASA, NOAA and GeoEye. This version has received funding from the European Community s Seventh Framework Programme ([FP7/2007-2013]) under grant agreement n. 282723 [OSS2015 project].
- registration :
- 5
- sensor :
- Moderate Resolution Imaging Spectroradiometer,Visible Infrared Imaging Radiometer Suite,Ocean and Land Colour Instrument
- sensor_name :
- MODISA,VIIRSN,OLCIa,VIIRSJ1,OLCIb
- sensor_name_list :
- MOD,VIR,OLA,VJ1,OLB
- site_name :
- GLO
- software_name :
- globcolour_l3_reproject
- software_version :
- 2022.2
- source :
- surface observation
- southernmost_latitude :
- -90.0
- southernmost_valid_latitude :
- -66.33333587646484
- standard_name_vocabulary :
- NetCDF Climate and Forecast (CF) Metadata Convention
- start_date :
- 2024-04-16 UTC
- start_time :
- 21:12:05 UTC
- stop_date :
- 2024-04-18 UTC
- stop_time :
- 02:58:23 UTC
- summary :
- CMEMS product: cmems_obs-oc_glo_bgc-plankton_my_l3-multi-4km_P1D, generated by ACRI-ST
- time_coverage_duration :
- PT107179S
- time_coverage_end :
- 2024-04-18T02:58:23Z
- time_coverage_resolution :
- P1D
- time_coverage_start :
- 2024-04-16T21:12:05Z
- title :
- cmems_obs-oc_glo_bgc-plankton_my_l3-multi-4km_P1D
- units :
- %
- valid_max :
- 32767
- valid_min :
- 0
- westernmost_longitude :
- -180.0
- westernmost_valid_longitude :
- -180.0
Array Chunk Bytes 2.55 GiB 16.27 MiB Shape (16071, 177, 241) (100, 177, 241) Dask graph 161 chunks in 2 graph layers Data type float32 numpy.ndarray - CHL_uncertainty(time, lat, lon)float32dask.array<chunksize=(100, 177, 241), meta=np.ndarray>
- _ChunkSizes :
- [1, 256, 256]
- coverage_content_type :
- qualityInformation
- long_name :
- Chlorophyll-a concentration - Uncertainty estimation
- units :
- %
- valid_max :
- 32767
- valid_min :
- 0
Array Chunk Bytes 2.55 GiB 16.27 MiB Shape (16071, 177, 241) (100, 177, 241) Dask graph 161 chunks in 2 graph layers Data type float32 numpy.ndarray - adt(time, lat, lon)float32dask.array<chunksize=(100, 177, 241), meta=np.ndarray>
- comment :
- The absolute dynamic topography is the sea surface height above geoid; the adt is obtained as follows: adt=sla+mdt where mdt is the mean dynamic topography; see the product user manual for details
- grid_mapping :
- crs
- long_name :
- Absolute dynamic topography
- standard_name :
- sea_surface_height_above_geoid
- units :
- m
Array Chunk Bytes 2.55 GiB 16.27 MiB Shape (16071, 177, 241) (100, 177, 241) Dask graph 161 chunks in 2 graph layers Data type float32 numpy.ndarray - air_temp(time, lat, lon)float32dask.array<chunksize=(100, 177, 241), meta=np.ndarray>
- long_name :
- 2 metre temperature
- nameCDM :
- 2_metre_temperature_surface
- nameECMWF :
- 2 metre temperature
- product_type :
- analysis
- shortNameECMWF :
- 2t
- standard_name :
- air_temperature
- units :
- K
Array Chunk Bytes 2.55 GiB 16.27 MiB Shape (16071, 177, 241) (100, 177, 241) Dask graph 161 chunks in 2 graph layers Data type float32 numpy.ndarray - curr_dir(time, lat, lon)float32dask.array<chunksize=(100, 177, 241), meta=np.ndarray>
- comments :
- Computed from total surface current velocity elements. Velocities are an average over the top 30m of the mixed layer
- depth :
- 15m
- long_name :
- average direction of total surface currents
- units :
- degrees
Array Chunk Bytes 2.55 GiB 16.27 MiB Shape (16071, 177, 241) (100, 177, 241) Dask graph 161 chunks in 2 graph layers Data type float32 numpy.ndarray - curr_speed(time, lat, lon)float32dask.array<chunksize=(100, 177, 241), meta=np.ndarray>
- comments :
- Velocities are an average over the top 30m of the mixed layer
- depth :
- 15m
- long_name :
- average total surface current speed
- units :
- m s**-1
Array Chunk Bytes 2.55 GiB 16.27 MiB Shape (16071, 177, 241) (100, 177, 241) Dask graph 161 chunks in 2 graph layers Data type float32 numpy.ndarray - mlotst(time, lat, lon)float32dask.array<chunksize=(500, 177, 241), meta=np.ndarray>
- _ChunkSizes :
- [1, 681, 1440]
- cell_methods :
- area: mean
- long_name :
- Density ocean mixed layer thickness
- standard_name :
- ocean_mixed_layer_thickness_defined_by_sigma_theta
- unit_long :
- Meters
- units :
- m
Array Chunk Bytes 2.55 GiB 81.36 MiB Shape (16071, 177, 241) (500, 177, 241) Dask graph 33 chunks in 2 graph layers Data type float32 numpy.ndarray - sla(time, lat, lon)float32dask.array<chunksize=(100, 177, 241), meta=np.ndarray>
- ancillary_variables :
- err_sla
- comment :
- The sea level anomaly is the sea surface height above mean sea surface; it is referenced to the [1993, 2012] period; see the product user manual for details
- grid_mapping :
- crs
- long_name :
- Sea level anomaly
- standard_name :
- sea_surface_height_above_sea_level
- units :
- m
Array Chunk Bytes 2.55 GiB 16.27 MiB Shape (16071, 177, 241) (100, 177, 241) Dask graph 161 chunks in 2 graph layers Data type float32 numpy.ndarray - so(time, lat, lon)float32dask.array<chunksize=(500, 177, 241), meta=np.ndarray>
- _ChunkSizes :
- [1, 7, 341, 720]
- cell_methods :
- area: mean
- long_name :
- mean sea water salinity at 0.49 metres below ocean surface
- standard_name :
- sea_water_salinity
- unit_long :
- Practical Salinity Unit
- units :
- 1e-3
- valid_max :
- 28336
- valid_min :
- 1
Array Chunk Bytes 2.55 GiB 81.36 MiB Shape (16071, 177, 241) (500, 177, 241) Dask graph 33 chunks in 2 graph layers Data type float32 numpy.ndarray - sst(time, lat, lon)float32dask.array<chunksize=(100, 177, 241), meta=np.ndarray>
- long_name :
- Sea surface temperature
- nameCDM :
- Sea_surface_temperature_surface
- nameECMWF :
- Sea surface temperature
- product_type :
- analysis
- shortNameECMWF :
- sst
- standard_name :
- sea_surface_temperature
- units :
- K
Array Chunk Bytes 2.55 GiB 16.27 MiB Shape (16071, 177, 241) (100, 177, 241) Dask graph 161 chunks in 2 graph layers Data type float32 numpy.ndarray - topo(lat, lon)float64dask.array<chunksize=(177, 241), meta=np.ndarray>
- colorBarMaximum :
- 8000.0
- colorBarMinimum :
- -8000.0
- colorBarPalette :
- Topography
- grid_mapping :
- GDAL_Geographics
- ioos_category :
- Location
- long_name :
- Topography
- standard_name :
- altitude
- units :
- meters
Array Chunk Bytes 333.26 kiB 333.26 kiB Shape (177, 241) (177, 241) Dask graph 1 chunks in 2 graph layers Data type float64 numpy.ndarray - u_curr(time, lat, lon)float32dask.array<chunksize=(100, 177, 241), meta=np.ndarray>
- comment :
- Velocities are an average over the top 30m of the mixed layer
- coverage_content_type :
- modelResult
- depth :
- 15m
- long_name :
- zonal total surface current
- source :
- SSH source: CMEMS SSALTO/DUACS SEALEVEL_GLO_PHY_L4_MY_008_047 DOI: 10.48670/moi-00148 ; WIND source: ECMWF ERA5 10m wind DOI: 10.24381/cds.adbb2d47 ; SST source: CMC 0.2 deg SST V2.0 DOI: 10.5067/GHCMC-4FM02
- standard_name :
- eastward_sea_water_velocity
- units :
- m s-1
- valid_max :
- 3.0
- valid_min :
- -3.0
Array Chunk Bytes 2.55 GiB 16.27 MiB Shape (16071, 177, 241) (100, 177, 241) Dask graph 161 chunks in 2 graph layers Data type float32 numpy.ndarray - u_wind(time, lat, lon)float32dask.array<chunksize=(100, 177, 241), meta=np.ndarray>
- long_name :
- 10 metre U wind component
- nameCDM :
- 10_metre_U_wind_component_surface
- nameECMWF :
- 10 metre U wind component
- product_type :
- analysis
- shortNameECMWF :
- 10u
- standard_name :
- eastward_wind
- units :
- m s**-1
Array Chunk Bytes 2.55 GiB 16.27 MiB Shape (16071, 177, 241) (100, 177, 241) Dask graph 161 chunks in 2 graph layers Data type float32 numpy.ndarray - ug_curr(time, lat, lon)float32dask.array<chunksize=(100, 177, 241), meta=np.ndarray>
- comment :
- Geostrophic velocities calculated from absolute dynamic topography
- depth :
- 15m
- long_name :
- zonal geostrophic surface current
- source :
- SSH source: CMEMS SSALTO/DUACS SEALEVEL_GLO_PHY_L4_MY_008_047 DOI: 10.48670/moi-00148
- standard_name :
- geostrophic_eastward_sea_water_velocity
- units :
- m s-1
- valid_max :
- 3.0
- valid_min :
- -3.0
Array Chunk Bytes 2.55 GiB 16.27 MiB Shape (16071, 177, 241) (100, 177, 241) Dask graph 161 chunks in 2 graph layers Data type float32 numpy.ndarray - v_curr(time, lat, lon)float32dask.array<chunksize=(100, 177, 241), meta=np.ndarray>
- comment :
- Velocities are an average over the top 30m of the mixed layer
- coverage_content_type :
- modelResult
- depth :
- 15m
- long_name :
- meridional total surface current
- source :
- SSH source: CMEMS SSALTO/DUACS SEALEVEL_GLO_PHY_L4_MY_008_047 DOI: 10.48670/moi-00148 ; WIND source: ECMWF ERA5 10m wind DOI: 10.24381/cds.adbb2d47 ; SST source: CMC 0.2 deg SST V2.0 DOI: 10.5067/GHCMC-4FM02
- standard_name :
- northward_sea_water_velocity
- units :
- m s-1
- valid_max :
- 3.0
- valid_min :
- -3.0
Array Chunk Bytes 2.55 GiB 16.27 MiB Shape (16071, 177, 241) (100, 177, 241) Dask graph 161 chunks in 2 graph layers Data type float32 numpy.ndarray - v_wind(time, lat, lon)float32dask.array<chunksize=(100, 177, 241), meta=np.ndarray>
- long_name :
- 10 metre V wind component
- nameCDM :
- 10_metre_V_wind_component_surface
- nameECMWF :
- 10 metre V wind component
- product_type :
- analysis
- shortNameECMWF :
- 10v
- standard_name :
- northward_wind
- units :
- m s**-1
Array Chunk Bytes 2.55 GiB 16.27 MiB Shape (16071, 177, 241) (100, 177, 241) Dask graph 161 chunks in 2 graph layers Data type float32 numpy.ndarray - vg_curr(time, lat, lon)float32dask.array<chunksize=(100, 177, 241), meta=np.ndarray>
- comment :
- Geostrophic velocities calculated from absolute dynamic topography
- depth :
- 15m
- long_name :
- meridional geostrophic surface current
- source :
- SSH source: CMEMS SSALTO/DUACS SEALEVEL_GLO_PHY_L4_MY_008_047 DOI: 10.48670/moi-00148
- standard_name :
- geostrophic_northward_sea_water_velocity
- units :
- m s-1
- valid_max :
- 3.0
- valid_min :
- -3.0
Array Chunk Bytes 2.55 GiB 16.27 MiB Shape (16071, 177, 241) (100, 177, 241) Dask graph 161 chunks in 2 graph layers Data type float32 numpy.ndarray - wind_dir(time, lat, lon)float32dask.array<chunksize=(100, 177, 241), meta=np.ndarray>
- long_name :
- 10 metre wind direction
- units :
- degrees
Array Chunk Bytes 2.55 GiB 16.27 MiB Shape (16071, 177, 241) (100, 177, 241) Dask graph 161 chunks in 2 graph layers Data type float32 numpy.ndarray - wind_speed(time, lat, lon)float32dask.array<chunksize=(100, 177, 241), meta=np.ndarray>
- long_name :
- 10 metre absolute speed
- units :
- m s**-1
Array Chunk Bytes 2.55 GiB 16.27 MiB Shape (16071, 177, 241) (100, 177, 241) Dask graph 161 chunks in 2 graph layers Data type float32 numpy.ndarray
- latPandasIndex
PandasIndex(Index([ 32.0, 31.75, 31.5, 31.25, 31.0, 30.75, 30.5, 30.25, 30.0, 29.75, ... -9.75, -10.0, -10.25, -10.5, -10.75, -11.0, -11.25, -11.5, -11.75, -12.0], dtype='float32', name='lat', length=177)) - lonPandasIndex
PandasIndex(Index([ 42.0, 42.25, 42.5, 42.75, 43.0, 43.25, 43.5, 43.75, 44.0, 44.25, ... 99.75, 100.0, 100.25, 100.5, 100.75, 101.0, 101.25, 101.5, 101.75, 102.0], dtype='float32', name='lon', length=241)) - timePandasIndex
PandasIndex(DatetimeIndex(['1979-01-01', '1979-01-02', '1979-01-03', '1979-01-04',
               '1979-01-05', '1979-01-06', '1979-01-07', '1979-01-08',
               '1979-01-09', '1979-01-10',
               ...
               '2022-12-22', '2022-12-23', '2022-12-24', '2022-12-25',
               '2022-12-26', '2022-12-27', '2022-12-28', '2022-12-29',
               '2022-12-30', '2022-12-31'],
              dtype='datetime64[ns]', name='time', length=16071, freq=None))
- Conventions :
- CF-1.8, ACDD-1.3
- DPM_reference :
- GC-UD-ACRI-PUG
- IODD_reference :
- GC-UD-ACRI-PUG
- acknowledgement :
- The Licensees will ensure that original CMEMS products - or value added products or derivative works developed from CMEMS Products including publications and pictures - shall credit CMEMS by explicitly making mention of the originator (CMEMS) in the following manner: <Generated using CMEMS Products, production centre ACRI-ST>
- citation :
- The Licensees will ensure that original CMEMS products - or value added products or derivative works developed from CMEMS Products including publications and pictures - shall credit CMEMS by explicitly making mention of the originator (CMEMS) in the following manner: <Generated using CMEMS Products, production centre ACRI-ST>
- cmems_product_id :
- OCEANCOLOUR_GLO_BGC_L3_MY_009_103
- cmems_production_unit :
- OC-ACRI-NICE-FR
- comment :
- average
- contact :
- servicedesk.cmems@acri-st.fr
- copernicusmarine_version :
- 1.3.1
- creation_date :
- 2024-04-25 UTC
- creation_time :
- 00:47:33 UTC
- creator_email :
- servicedesk.cmems@acri-st.fr
- creator_name :
- ACRI
- creator_url :
- http://marine.copernicus.eu
- date_created :
- 2024-04-25T00:47:33Z
- distribution_statement :
- See CMEMS Data License
- duration_time :
- PT107179S
- earth_radius :
- 6378.137
- easternmost_longitude :
- 180.0
- easternmost_valid_longitude :
- 180.00001525878906
- file_quality_index :
- 0
- geospatial_bounds :
- POLYGON ((90.000000 -180.000000, 90.000000 180.000000, -90.000000 180.000000, -90.000000 -180.000000, 90.000000 -180.000000))
- geospatial_bounds_crs :
- EPSG:4326
- geospatial_bounds_vertical_crs :
- EPSG:5829
- geospatial_lat_max :
- 89.97916412353516
- geospatial_lat_min :
- -89.97917175292969
- geospatial_lon_max :
- 179.9791717529297
- geospatial_lon_min :
- -179.9791717529297
- geospatial_vertical_max :
- 0
- geospatial_vertical_min :
- 0
- geospatial_vertical_positive :
- up
- grid_mapping :
- Equirectangular
- grid_resolution :
- 4.638312339782715
- history :
- Created using software developed at ACRI-ST
- id :
- 20240417_cmems_obs-oc_glo_bgc-plankton_myint_l3-multi-4km_P1D
- institution :
- ACRI
- keywords :
- EARTH SCIENCE > OCEANS > OCEAN CHEMISTRY > CHLOROPHYLL, EARTH SCIENCE > BIOLOGICAL CLASSIFICATION > PROTISTS > PLANKTON > PHYTOPLANKTON
- keywords_vocabulary :
- NASA Global Change Master Directory (GCMD) Science Keywords
- lat_step :
- 0.0416666679084301
- license :
- See CMEMS Data License
- lon_step :
- 0.0416666679084301
- naming_authority :
- CMEMS
- nb_bins :
- 37324800
- nb_equ_bins :
- 8640
- nb_grid_bins :
- 37324800
- nb_valid_bins :
- 9704694
- netcdf_version_id :
- 4.3.3.1 of Jul 8 2016 18:15:50 $
- northernmost_latitude :
- 90.0
- northernmost_valid_latitude :
- 82.70833587646484
- overall_quality :
- mode=myint
- parameter :
- Chlorophyll-a concentration,Phytoplankton Functional Types
- parameter_code :
- CHL,DIATO,DINO,HAPTO,GREEN,PROKAR,PROCHLO,MICRO,NANO,PICO
- pct_bins :
- 100.0
- pct_valid_bins :
- 26.000659079218106
- period_duration_day :
- P1D
- period_end_day :
- 20240417
- period_start_day :
- 20240417
- platform :
- Aqua,Suomi-NPP,Sentinel-3a,JPSS-1 (NOAA-20),Sentinel-3b
- processing_level :
- L3
- product_level :
- 3
- product_name :
- 20240417_cmems_obs-oc_glo_bgc-plankton_myint_l3-multi-4km_P1D
- product_type :
- day
- project :
- CMEMS
- publication :
- Gohin, F., Druon, J. N., Lampert, L. (2002). A five channel chlorophyll concentration algorithm applied to SeaWiFS data processed by SeaDAS in coastal waters. International journal of remote sensing, 23(8), 1639-1661 + Hu, C., Lee, Z., Franz, B. (2012). Chlorophyll a algorithms for oligotrophic oceans: A novel approach based on three-band reflectance difference. Journal of Geophysical Research, 117(C1). doi: 10.1029/2011jc007395 + Xi H, Losa S N, Mangin A, Garnesson P, Bretagnon M, Demaria J, Soppa M A, Hembise Fanton d Andon O, Bracher A (2021) Global chlorophyll a concentrations of phytoplankton functional types with detailed uncertainty assessment using multi-sensor ocean color and sea surface temperature satellite products, JGR, in review.
- publisher_email :
- servicedesk.cmems@mercator-ocean.eu
- publisher_name :
- CMEMS
- publisher_url :
- http://marine.copernicus.eu
- references :
- http://www.globcolour.info GlobColour has been originally funded by ESA with data from ESA, NASA, NOAA and GeoEye. This version has received funding from the European Community s Seventh Framework Programme ([FP7/2007-2013]) under grant agreement n. 282723 [OSS2015 project].
- registration :
- 5
- sensor :
- Moderate Resolution Imaging Spectroradiometer,Visible Infrared Imaging Radiometer Suite,Ocean and Land Colour Instrument
- sensor_name :
- MODISA,VIIRSN,OLCIa,VIIRSJ1,OLCIb
- sensor_name_list :
- MOD,VIR,OLA,VJ1,OLB
- site_name :
- GLO
- software_name :
- globcolour_l3_reproject
- software_version :
- 2022.2
- source :
- surface observation
- southernmost_latitude :
- -90.0
- southernmost_valid_latitude :
- -66.33333587646484
- standard_name_vocabulary :
- NetCDF Climate and Forecast (CF) Metadata Convention
- start_date :
- 2024-04-16 UTC
- start_time :
- 21:12:05 UTC
- stop_date :
- 2024-04-18 UTC
- stop_time :
- 02:58:23 UTC
- summary :
- CMEMS product: cmems_obs-oc_glo_bgc-plankton_my_l3-multi-4km_P1D, generated by ACRI-ST
- time_coverage_duration :
- PT107179S
- time_coverage_end :
- 2024-04-18T02:58:23Z
- time_coverage_resolution :
- P1D
- time_coverage_start :
- 2024-04-16T21:12:05Z
- title :
- cmems_obs-oc_glo_bgc-plankton_my_l3-multi-4km_P1D
- westernmost_longitude :
- -180.0
- westernmost_valid_longitude :
- -180.0
ds.lat.size * ds.lon.size
42657
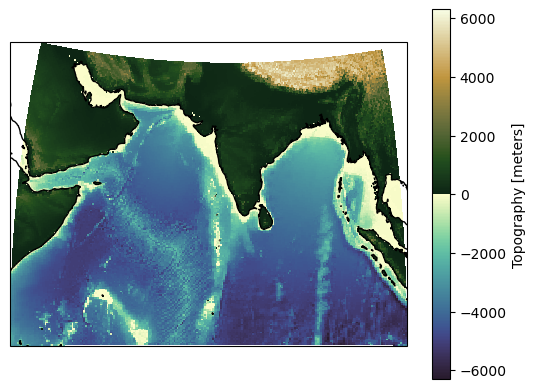
Plot bathymetry#
projection = ccrs.Stereographic(central_longitude=75., central_latitude=10.)
ax = ds.topo.plot(transform=ccrs.PlateCarree(),
                                     subplot_kws=dict(projection=projection),
                                     cmap=cmocean.cm.topo)
ax.axes.coastlines()
<cartopy.mpl.feature_artist.FeatureArtist at 0x7fdac2ef1bd0>
Plot climatology of cloud cover by month#
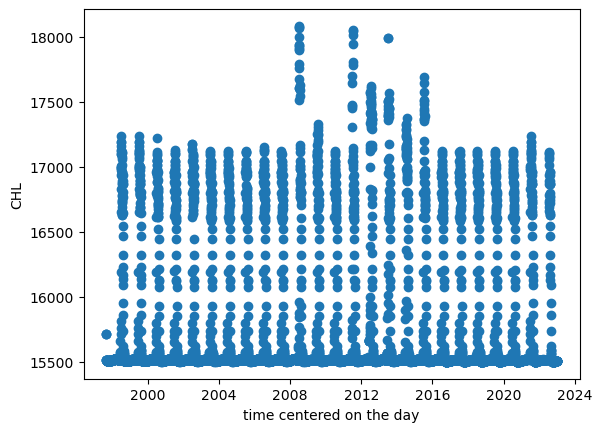
A first klugey effort
idx = (ds.CHL.isnull().sum(dim=["lat","lon"]) < (ds.lat.size * ds.lon.size)).compute()
ds = ds.sel(time=ds.time[idx])
ds.CHL.isnull().sum(dim=["lat","lon"]).plot(marker='o', ls="")
[<matplotlib.lines.Line2D at 0x7fdacc8411d0>]
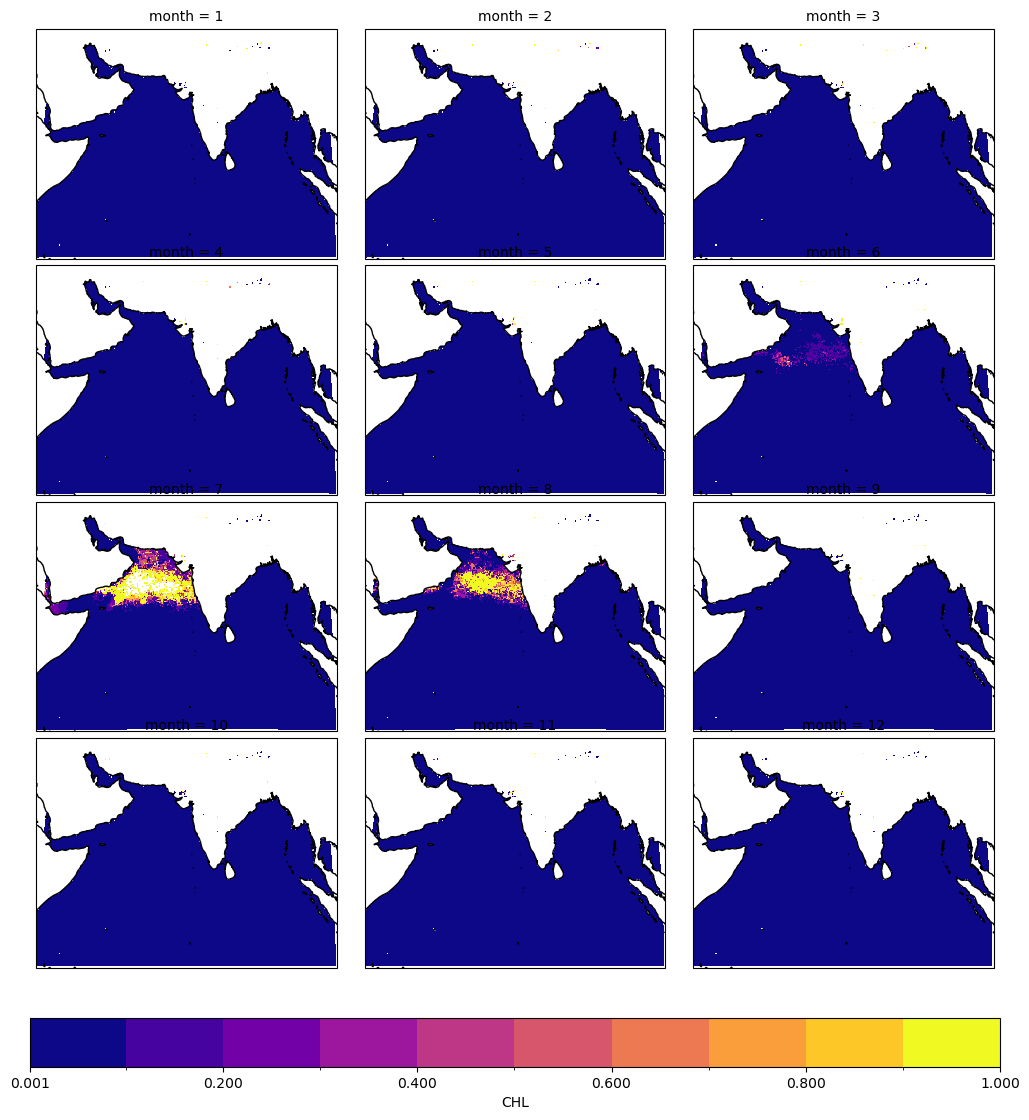
chl_count = ds.CHL.isnull().groupby(ds.time.dt.month).sum() / ds.CHL.groupby(ds.time.dt.month).count()
bounds = [0.001, 0.1, 0.2, 0.3, 0.4, 0.5, 0.6, 0.7, 0.8, 0.9, 1.0]  #np.arange(0,1.1,0.1)
norm = BoundaryNorm(bounds, ncolors=256, clip=True)
p = chl_count.plot(
    col="month",
    col_wrap=3,
    norm=norm,
    cmap="plasma",
    transform=ccrs.PlateCarree(),
    subplot_kws=dict(
        projection=projection,
    ),
    cbar_kwargs=dict(
        orientation="horizontal",
        spacing="proportional",
        extend="neither"),
    )
#[ax.axes.add_feature(cfeature.LAND) for ax in p.axs.flat];
[ax.axes.coastlines() for ax in p.axs.flat];
p.fig.subplots_adjust(bottom=0.2)
# plt.tight_layout()
Plot climatologies#
Winds
SST
CHL
Currents
ds_mon = ds.resample({"time":'MS'}).mean()
ds_clm = ds_mon.groupby(ds_mon.time.dt.month).mean()
ds_clm
<xarray.Dataset> Size: 61MB
Dimensions:                       (month: 12, lat: 177, lon: 241)
Coordinates:
  * lat                           (lat) float32 708B 32.0 31.75 ... -11.75 -12.0
  * lon                           (lon) float32 964B 42.0 42.25 ... 101.8 102.0
  * month                         (month) int64 96B 1 2 3 4 5 6 7 8 9 10 11 12
Data variables: (12/27)
    CHL                           (month, lat, lon) float32 2MB dask.array<chunksize=(3, 177, 241), meta=np.ndarray>
    CHL_cmes-cloud                (month, lat, lon) float64 4MB dask.array<chunksize=(3, 177, 241), meta=np.ndarray>
    CHL_cmes-gapfree              (month, lat, lon) float32 2MB dask.array<chunksize=(3, 177, 241), meta=np.ndarray>
    CHL_cmes-level3               (month, lat, lon) float32 2MB dask.array<chunksize=(3, 177, 241), meta=np.ndarray>
    CHL_cmes_flags-gapfree        (month, lat, lon) float32 2MB dask.array<chunksize=(3, 177, 241), meta=np.ndarray>
    CHL_cmes_flags-level3         (month, lat, lon) float32 2MB dask.array<chunksize=(3, 177, 241), meta=np.ndarray>
    ...                            ...
    v_wind                        (month, lat, lon) float32 2MB dask.array<chunksize=(3, 177, 241), meta=np.ndarray>
    vg_curr                       (month, lat, lon) float32 2MB dask.array<chunksize=(3, 177, 241), meta=np.ndarray>
    wind_dir                      (month, lat, lon) float32 2MB dask.array<chunksize=(3, 177, 241), meta=np.ndarray>
    wind_speed                    (month, lat, lon) float32 2MB dask.array<chunksize=(3, 177, 241), meta=np.ndarray>
    CHL_cmes-land                 (month, lat, lon) float64 4MB dask.array<chunksize=(12, 177, 241), meta=np.ndarray>
    topo                          (month, lat, lon) float64 4MB dask.array<chunksize=(12, 177, 241), meta=np.ndarray>
Attributes: (12/92)
    Conventions:                     CF-1.8, ACDD-1.3
    DPM_reference:                   GC-UD-ACRI-PUG
    IODD_reference:                  GC-UD-ACRI-PUG
    acknowledgement:                 The Licensees will ensure that original ...
    citation:                        The Licensees will ensure that original ...
    cmems_product_id:                OCEANCOLOUR_GLO_BGC_L3_MY_009_103
    ...                              ...
    time_coverage_end:               2024-04-18T02:58:23Z
    time_coverage_resolution:        P1D
    time_coverage_start:             2024-04-16T21:12:05Z
    title:                           cmems_obs-oc_glo_bgc-plankton_my_l3-mult...
    westernmost_longitude:           -180.0
    westernmost_valid_longitude:     -180.0
xarray.Dataset
- month: 12
- lat: 177
- lon: 241
- lat(lat)float3232.0 31.75 31.5 ... -11.75 -12.0
- long_name :
- latitude
- standard_name :
- latitude
- units :
- degrees_north
array([ 32. , 31.75, 31.5 , 31.25, 31. , 30.75, 30.5 , 30.25, 30. , 29.75, 29.5 , 29.25, 29. , 28.75, 28.5 , 28.25, 28. , 27.75, 27.5 , 27.25, 27. , 26.75, 26.5 , 26.25, 26. , 25.75, 25.5 , 25.25, 25. , 24.75, 24.5 , 24.25, 24. , 23.75, 23.5 , 23.25, 23. , 22.75, 22.5 , 22.25, 22. , 21.75, 21.5 , 21.25, 21. , 20.75, 20.5 , 20.25, 20. , 19.75, 19.5 , 19.25, 19. , 18.75, 18.5 , 18.25, 18. , 17.75, 17.5 , 17.25, 17. , 16.75, 16.5 , 16.25, 16. , 15.75, 15.5 , 15.25, 15. , 14.75, 14.5 , 14.25, 14. , 13.75, 13.5 , 13.25, 13. , 12.75, 12.5 , 12.25, 12. , 11.75, 11.5 , 11.25, 11. , 10.75, 10.5 , 10.25, 10. , 9.75, 9.5 , 9.25, 9. , 8.75, 8.5 , 8.25, 8. , 7.75, 7.5 , 7.25, 7. , 6.75, 6.5 , 6.25, 6. , 5.75, 5.5 , 5.25, 5. , 4.75, 4.5 , 4.25, 4. , 3.75, 3.5 , 3.25, 3. , 2.75, 2.5 , 2.25, 2. , 1.75, 1.5 , 1.25, 1. , 0.75, 0.5 , 0.25, 0. , -0.25, -0.5 , -0.75, -1. , -1.25, -1.5 , -1.75, -2. , -2.25, -2.5 , -2.75, -3. , -3.25, -3.5 , -3.75, -4. , -4.25, -4.5 , -4.75, -5. , -5.25, -5.5 , -5.75, -6. , -6.25, -6.5 , -6.75, -7. , -7.25, -7.5 , -7.75, -8. , -8.25, -8.5 , -8.75, -9. , -9.25, -9.5 , -9.75, -10. , -10.25, -10.5 , -10.75, -11. , -11.25, -11.5 , -11.75, -12. ], dtype=float32) - lon(lon)float3242.0 42.25 42.5 ... 101.8 102.0
- long_name :
- longitude
- standard_name :
- longitude
- units :
- degrees_east
array([ 42. , 42.25, 42.5 , ..., 101.5 , 101.75, 102. ], dtype=float32)
- month(month)int641 2 3 4 5 6 7 8 9 10 11 12
array([ 1, 2, 3, 4, 5, 6, 7, 8, 9, 10, 11, 12])
- CHL(month, lat, lon)float32dask.array<chunksize=(3, 177, 241), meta=np.ndarray>
- _ChunkSizes :
- [1, 256, 256]
- ancillary_variables :
- flags CHL_uncertainty
- coverage_content_type :
- modelResult
- input_files_reprocessings :
- Processors versions: MODIS R2022.0NRT/VIIRSN R2022.0NRT/OLCIA 07.02/VIIRSJ1 R2022.0NRT/OLCIB 07.02
- long_name :
- Chlorophyll-a concentration - Mean of the binned pixels
- standard_name :
- mass_concentration_of_chlorophyll_a_in_sea_water
- type :
- surface
- units :
- milligram m-3
- valid_max :
- 1000.0
- valid_min :
- 0.0
Array Chunk Bytes 1.95 MiB 499.89 kiB Shape (12, 177, 241) (3, 177, 241) Dask graph 4 chunks in 214 graph layers Data type float32 numpy.ndarray - CHL_cmes-cloud(month, lat, lon)float64dask.array<chunksize=(3, 177, 241), meta=np.ndarray>
- title :
- flag for CHL-gapfree and CHL-level3. 0 is land; 1 is cloud; 0 is water
Array Chunk Bytes 3.91 MiB 0.98 MiB Shape (12, 177, 241) (3, 177, 241) Dask graph 4 chunks in 214 graph layers Data type float64 numpy.ndarray - CHL_cmes-gapfree(month, lat, lon)float32dask.array<chunksize=(3, 177, 241), meta=np.ndarray>
- Conventions :
- CF-1.8, ACDD-1.3
- DPM_reference :
- GC-UD-ACRI-PUG
- IODD_reference :
- GC-UD-ACRI-PUG
- acknowledgement :
- The Licensees will ensure that original CMEMS products - or value added products or derivative works developed from CMEMS Products including publications and pictures - shall credit CMEMS by explicitly making mention of the originator (CMEMS) in the following manner: <Generated using CMEMS Products, production centre ACRI-ST>
- ancillary_variables :
- flags CHL_uncertainty
- citation :
- The Licensees will ensure that original CMEMS products - or value added products or derivative works developed from CMEMS Products including publications and pictures - shall credit CMEMS by explicitly making mention of the originator (CMEMS) in the following manner: <Generated using CMEMS Products, production centre ACRI-ST>
- cmems_product_id :
- OCEANCOLOUR_GLO_BGC_L4_MY_009_104
- cmems_production_unit :
- OC-ACRI-NICE-FR
- comment :
- average
- contact :
- servicedesk.cmems@acri-st.fr
- copernicusmarine_version :
- 1.3.1
- coverage_content_type :
- modelResult
- creation_date :
- 2023-11-29 UTC
- creation_time :
- 01:06:50 UTC
- creator_email :
- servicedesk.cmems@acri-st.fr
- creator_name :
- ACRI
- creator_url :
- http://marine.copernicus.eu
- date_created :
- 2023-11-29T01:06:50Z
- distribution_statement :
- See CMEMS Data License
- duration_time :
- PT146878S
- earth_radius :
- 6378.137
- easternmost_longitude :
- 180.0
- easternmost_valid_longitude :
- 180.00001525878906
- file_quality_index :
- 0
- geospatial_bounds :
- POLYGON ((90.000000 -180.000000, 90.000000 180.000000, -90.000000 180.000000, -90.000000 -180.000000, 90.000000 -180.000000))
- geospatial_bounds_crs :
- EPSG:4326
- geospatial_bounds_vertical_crs :
- EPSG:5829
- geospatial_lat_max :
- 89.97916412353516
- geospatial_lat_min :
- -89.97917175292969
- geospatial_lon_max :
- 179.9791717529297
- geospatial_lon_min :
- -179.9791717529297
- geospatial_vertical_max :
- 0
- geospatial_vertical_min :
- 0
- geospatial_vertical_positive :
- up
- grid_mapping :
- Equirectangular
- grid_resolution :
- 4.638312339782715
- history :
- Created using software developed at ACRI-ST
- id :
- 20231121_cmems_obs-oc_glo_bgc-plankton_myint_l4-gapfree-multi-4km_P1D
- input_files_reprocessings :
- Processors versions: MODIS R2022.0NRT/VIIRSN R2022.0.1NRT/OLCIA 07.02/VIIRSJ1 R2022.0NRT/OLCIB 07.02
- institution :
- ACRI
- keywords :
- EARTH SCIENCE > OCEANS > OCEAN CHEMISTRY > CHLOROPHYLL
- keywords_vocabulary :
- NASA Global Change Master Directory (GCMD) Science Keywords
- lat_step :
- 0.0416666679084301
- license :
- See CMEMS Data License
- lon_step :
- 0.0416666679084301
- long_name :
- Chlorophyll-a concentration - Mean of the binned pixels
- naming_authority :
- CMEMS
- nb_bins :
- 37324800
- nb_equ_bins :
- 8640
- nb_grid_bins :
- 37324800
- nb_valid_bins :
- 19169208
- netcdf_version_id :
- 4.3.3.1 of Jul 8 2016 18:15:50 $
- northernmost_latitude :
- 90.0
- northernmost_valid_latitude :
- 58.08333206176758
- overall_quality :
- mode=myint
- parameter :
- Chlorophyll-a concentration
- parameter_code :
- CHL
- pct_bins :
- 100.0
- pct_valid_bins :
- 51.357831790123456
- period_duration_day :
- P1D
- period_end_day :
- 20231121
- period_start_day :
- 20231121
- platform :
- Aqua,Suomi-NPP,Sentinel-3a,JPSS-1 (NOAA-20),Sentinel-3b
- processing_level :
- L4
- product_level :
- 4
- product_name :
- 20231121_cmems_obs-oc_glo_bgc-plankton_myint_l4-gapfree-multi-4km_P1D
- product_type :
- day
- project :
- CMEMS
- publication :
- Gohin, F., Druon, J. N., Lampert, L. (2002). A five channel chlorophyll concentration algorithm applied to SeaWiFS data processed by SeaDAS in coastal waters. International journal of remote sensing, 23(8), 1639-1661 + Hu, C., Lee, Z., Franz, B. (2012). Chlorophyll a algorithms for oligotrophic oceans: A novel approach based on three-band reflectance difference. Journal of Geophysical Research, 117(C1). doi: 10.1029/2011jc007395
- publisher_email :
- servicedesk.cmems@mercator-ocean.eu
- publisher_name :
- CMEMS
- publisher_url :
- http://marine.copernicus.eu
- references :
- http://www.globcolour.info GlobColour has been originally funded by ESA with data from ESA, NASA, NOAA and GeoEye. This version has received funding from the European Community s Seventh Framework Programme ([FP7/2007-2013]) under grant agreement n. 282723 [OSS2015 project].
- registration :
- 5
- sensor :
- Moderate Resolution Imaging Spectroradiometer,Visible Infrared Imaging Radiometer Suite,Ocean and Land Colour Instrument
- sensor_name :
- MODISA,VIIRSN,OLCIa,VIIRSJ1,OLCIb
- sensor_name_list :
- MOD,VIR,OLA,VJ1,OLB
- site_name :
- GLO
- software_name :
- globcolour_l3_reproject
- software_version :
- 2022.2
- source :
- surface observation
- southernmost_latitude :
- -90.0
- southernmost_valid_latitude :
- -78.58333587646484
- standard_name :
- mass_concentration_of_chlorophyll_a_in_sea_water
- standard_name_vocabulary :
- NetCDF Climate and Forecast (CF) Metadata Convention
- start_date :
- 2023-11-20 UTC
- start_time :
- 15:24:55 UTC
- stop_date :
- 2023-11-22 UTC
- stop_time :
- 08:12:52 UTC
- summary :
- CMEMS product: cmems_obs-oc_glo_bgc-plankton_my_l4-gapfree-multi-4km_P1D, generated by ACRI-ST
- time_coverage_duration :
- PT146878S
- time_coverage_end :
- 2023-11-22T08:12:52Z
- time_coverage_resolution :
- P1D
- time_coverage_start :
- 2023-11-20T15:24:55Z
- title :
- cmems_obs-oc_glo_bgc-plankton_my_l4-gapfree-multi-4km_P1D
- type :
- surface
- units :
- milligram m-3
- valid_max :
- 1000.0
- valid_min :
- 0.0
- westernmost_longitude :
- -180.0
- westernmost_valid_longitude :
- -180.0
Array Chunk Bytes 1.95 MiB 499.89 kiB Shape (12, 177, 241) (3, 177, 241) Dask graph 4 chunks in 214 graph layers Data type float32 numpy.ndarray - CHL_cmes-level3(month, lat, lon)float32dask.array<chunksize=(3, 177, 241), meta=np.ndarray>
- Conventions :
- CF-1.8, ACDD-1.3
- DPM_reference :
- GC-UD-ACRI-PUG
- IODD_reference :
- GC-UD-ACRI-PUG
- acknowledgement :
- The Licensees will ensure that original CMEMS products - or value added products or derivative works developed from CMEMS Products including publications and pictures - shall credit CMEMS by explicitly making mention of the originator (CMEMS) in the following manner: <Generated using CMEMS Products, production centre ACRI-ST>
- ancillary_variables :
- flags CHL_uncertainty
- citation :
- The Licensees will ensure that original CMEMS products - or value added products or derivative works developed from CMEMS Products including publications and pictures - shall credit CMEMS by explicitly making mention of the originator (CMEMS) in the following manner: <Generated using CMEMS Products, production centre ACRI-ST>
- cmems_product_id :
- OCEANCOLOUR_GLO_BGC_L3_MY_009_103
- cmems_production_unit :
- OC-ACRI-NICE-FR
- comment :
- average
- contact :
- servicedesk.cmems@acri-st.fr
- copernicusmarine_version :
- 1.3.1
- coverage_content_type :
- modelResult
- creation_date :
- 2024-04-25 UTC
- creation_time :
- 00:47:33 UTC
- creator_email :
- servicedesk.cmems@acri-st.fr
- creator_name :
- ACRI
- creator_url :
- http://marine.copernicus.eu
- date_created :
- 2024-04-25T00:47:33Z
- distribution_statement :
- See CMEMS Data License
- duration_time :
- PT107179S
- earth_radius :
- 6378.137
- easternmost_longitude :
- 180.0
- easternmost_valid_longitude :
- 180.00001525878906
- file_quality_index :
- 0
- geospatial_bounds :
- POLYGON ((90.000000 -180.000000, 90.000000 180.000000, -90.000000 180.000000, -90.000000 -180.000000, 90.000000 -180.000000))
- geospatial_bounds_crs :
- EPSG:4326
- geospatial_bounds_vertical_crs :
- EPSG:5829
- geospatial_lat_max :
- 89.97916412353516
- geospatial_lat_min :
- -89.97917175292969
- geospatial_lon_max :
- 179.9791717529297
- geospatial_lon_min :
- -179.9791717529297
- geospatial_vertical_max :
- 0
- geospatial_vertical_min :
- 0
- geospatial_vertical_positive :
- up
- grid_mapping :
- Equirectangular
- grid_resolution :
- 4.638312339782715
- history :
- Created using software developed at ACRI-ST
- id :
- 20240417_cmems_obs-oc_glo_bgc-plankton_myint_l3-multi-4km_P1D
- input_files_reprocessings :
- Processors versions: MODIS R2022.0NRT/VIIRSN R2022.0.1NRT/OLCIA 07.04/VIIRSJ1 R2022.0NRT/OLCIB 07.04
- institution :
- ACRI
- keywords :
- EARTH SCIENCE > OCEANS > OCEAN CHEMISTRY > CHLOROPHYLL, EARTH SCIENCE > BIOLOGICAL CLASSIFICATION > PROTISTS > PLANKTON > PHYTOPLANKTON
- keywords_vocabulary :
- NASA Global Change Master Directory (GCMD) Science Keywords
- lat_step :
- 0.0416666679084301
- license :
- See CMEMS Data License
- lon_step :
- 0.0416666679084301
- long_name :
- Chlorophyll-a concentration - Mean of the binned pixels
- naming_authority :
- CMEMS
- nb_bins :
- 37324800
- nb_equ_bins :
- 8640
- nb_grid_bins :
- 37324800
- nb_valid_bins :
- 9704694
- netcdf_version_id :
- 4.3.3.1 of Jul 8 2016 18:15:50 $
- northernmost_latitude :
- 90.0
- northernmost_valid_latitude :
- 82.70833587646484
- overall_quality :
- mode=myint
- parameter :
- Chlorophyll-a concentration,Phytoplankton Functional Types
- parameter_code :
- CHL,DIATO,DINO,HAPTO,GREEN,PROKAR,PROCHLO,MICRO,NANO,PICO
- pct_bins :
- 100.0
- pct_valid_bins :
- 26.000659079218106
- period_duration_day :
- P1D
- period_end_day :
- 20240417
- period_start_day :
- 20240417
- platform :
- Aqua,Suomi-NPP,Sentinel-3a,JPSS-1 (NOAA-20),Sentinel-3b
- processing_level :
- L3
- product_level :
- 3
- product_name :
- 20240417_cmems_obs-oc_glo_bgc-plankton_myint_l3-multi-4km_P1D
- product_type :
- day
- project :
- CMEMS
- publication :
- Gohin, F., Druon, J. N., Lampert, L. (2002). A five channel chlorophyll concentration algorithm applied to SeaWiFS data processed by SeaDAS in coastal waters. International journal of remote sensing, 23(8), 1639-1661 + Hu, C., Lee, Z., Franz, B. (2012). Chlorophyll a algorithms for oligotrophic oceans: A novel approach based on three-band reflectance difference. Journal of Geophysical Research, 117(C1). doi: 10.1029/2011jc007395 + Xi H, Losa S N, Mangin A, Garnesson P, Bretagnon M, Demaria J, Soppa M A, Hembise Fanton d Andon O, Bracher A (2021) Global chlorophyll a concentrations of phytoplankton functional types with detailed uncertainty assessment using multi-sensor ocean color and sea surface temperature satellite products, JGR, in review.
- publisher_email :
- servicedesk.cmems@mercator-ocean.eu
- publisher_name :
- CMEMS
- publisher_url :
- http://marine.copernicus.eu
- references :
- http://www.globcolour.info GlobColour has been originally funded by ESA with data from ESA, NASA, NOAA and GeoEye. This version has received funding from the European Community s Seventh Framework Programme ([FP7/2007-2013]) under grant agreement n. 282723 [OSS2015 project].
- registration :
- 5
- sensor :
- Moderate Resolution Imaging Spectroradiometer,Visible Infrared Imaging Radiometer Suite,Ocean and Land Colour Instrument
- sensor_name :
- MODISA,VIIRSN,OLCIa,VIIRSJ1,OLCIb
- sensor_name_list :
- MOD,VIR,OLA,VJ1,OLB
- site_name :
- GLO
- software_name :
- globcolour_l3_reproject
- software_version :
- 2022.2
- source :
- surface observation
- southernmost_latitude :
- -90.0
- southernmost_valid_latitude :
- -66.33333587646484
- standard_name :
- mass_concentration_of_chlorophyll_a_in_sea_water
- standard_name_vocabulary :
- NetCDF Climate and Forecast (CF) Metadata Convention
- start_date :
- 2024-04-16 UTC
- start_time :
- 21:12:05 UTC
- stop_date :
- 2024-04-18 UTC
- stop_time :
- 02:58:23 UTC
- summary :
- CMEMS product: cmems_obs-oc_glo_bgc-plankton_my_l3-multi-4km_P1D, generated by ACRI-ST
- time_coverage_duration :
- PT107179S
- time_coverage_end :
- 2024-04-18T02:58:23Z
- time_coverage_resolution :
- P1D
- time_coverage_start :
- 2024-04-16T21:12:05Z
- title :
- cmems_obs-oc_glo_bgc-plankton_my_l3-multi-4km_P1D
- type :
- surface
- units :
- milligram m-3
- valid_max :
- 1000.0
- valid_min :
- 0.0
- westernmost_longitude :
- -180.0
- westernmost_valid_longitude :
- -180.0
Array Chunk Bytes 1.95 MiB 499.89 kiB Shape (12, 177, 241) (3, 177, 241) Dask graph 4 chunks in 214 graph layers Data type float32 numpy.ndarray - CHL_cmes_flags-gapfree(month, lat, lon)float32dask.array<chunksize=(3, 177, 241), meta=np.ndarray>
- Conventions :
- CF-1.8, ACDD-1.3
- DPM_reference :
- GC-UD-ACRI-PUG
- IODD_reference :
- GC-UD-ACRI-PUG
- acknowledgement :
- The Licensees will ensure that original CMEMS products - or value added products or derivative works developed from CMEMS Products including publications and pictures - shall credit CMEMS by explicitly making mention of the originator (CMEMS) in the following manner: <Generated using CMEMS Products, production centre ACRI-ST>
- citation :
- The Licensees will ensure that original CMEMS products - or value added products or derivative works developed from CMEMS Products including publications and pictures - shall credit CMEMS by explicitly making mention of the originator (CMEMS) in the following manner: <Generated using CMEMS Products, production centre ACRI-ST>
- cmems_product_id :
- OCEANCOLOUR_GLO_BGC_L4_MY_009_104
- cmems_production_unit :
- OC-ACRI-NICE-FR
- comment :
- average
- contact :
- servicedesk.cmems@acri-st.fr
- copernicusmarine_version :
- 1.3.1
- coverage_content_type :
- auxiliaryInformation
- creation_date :
- 2023-11-29 UTC
- creation_time :
- 01:06:50 UTC
- creator_email :
- servicedesk.cmems@acri-st.fr
- creator_name :
- ACRI
- creator_url :
- http://marine.copernicus.eu
- date_created :
- 2023-11-29T01:06:50Z
- distribution_statement :
- See CMEMS Data License
- duration_time :
- PT146878S
- earth_radius :
- 6378.137
- easternmost_longitude :
- 180.0
- easternmost_valid_longitude :
- 180.00001525878906
- file_quality_index :
- 0
- flag_masks :
- [1, 2]
- flag_meanings :
- LAND INTERPOLATED
- geospatial_bounds :
- POLYGON ((90.000000 -180.000000, 90.000000 180.000000, -90.000000 180.000000, -90.000000 -180.000000, 90.000000 -180.000000))
- geospatial_bounds_crs :
- EPSG:4326
- geospatial_bounds_vertical_crs :
- EPSG:5829
- geospatial_lat_max :
- 89.97916412353516
- geospatial_lat_min :
- -89.97917175292969
- geospatial_lon_max :
- 179.9791717529297
- geospatial_lon_min :
- -179.9791717529297
- geospatial_vertical_max :
- 0
- geospatial_vertical_min :
- 0
- geospatial_vertical_positive :
- up
- grid_mapping :
- Equirectangular
- grid_resolution :
- 4.638312339782715
- history :
- Created using software developed at ACRI-ST
- id :
- 20231121_cmems_obs-oc_glo_bgc-plankton_myint_l4-gapfree-multi-4km_P1D
- institution :
- ACRI
- keywords :
- EARTH SCIENCE > OCEANS > OCEAN CHEMISTRY > CHLOROPHYLL
- keywords_vocabulary :
- NASA Global Change Master Directory (GCMD) Science Keywords
- lat_step :
- 0.0416666679084301
- license :
- See CMEMS Data License
- lon_step :
- 0.0416666679084301
- long_name :
- Flags
- naming_authority :
- CMEMS
- nb_bins :
- 37324800
- nb_equ_bins :
- 8640
- nb_grid_bins :
- 37324800
- nb_valid_bins :
- 19169208
- netcdf_version_id :
- 4.3.3.1 of Jul 8 2016 18:15:50 $
- northernmost_latitude :
- 90.0
- northernmost_valid_latitude :
- 58.08333206176758
- overall_quality :
- mode=myint
- parameter :
- Chlorophyll-a concentration
- parameter_code :
- CHL
- pct_bins :
- 100.0
- pct_valid_bins :
- 51.357831790123456
- period_duration_day :
- P1D
- period_end_day :
- 20231121
- period_start_day :
- 20231121
- platform :
- Aqua,Suomi-NPP,Sentinel-3a,JPSS-1 (NOAA-20),Sentinel-3b
- processing_level :
- L4
- product_level :
- 4
- product_name :
- 20231121_cmems_obs-oc_glo_bgc-plankton_myint_l4-gapfree-multi-4km_P1D
- product_type :
- day
- project :
- CMEMS
- publication :
- Gohin, F., Druon, J. N., Lampert, L. (2002). A five channel chlorophyll concentration algorithm applied to SeaWiFS data processed by SeaDAS in coastal waters. International journal of remote sensing, 23(8), 1639-1661 + Hu, C., Lee, Z., Franz, B. (2012). Chlorophyll a algorithms for oligotrophic oceans: A novel approach based on three-band reflectance difference. Journal of Geophysical Research, 117(C1). doi: 10.1029/2011jc007395
- publisher_email :
- servicedesk.cmems@mercator-ocean.eu
- publisher_name :
- CMEMS
- publisher_url :
- http://marine.copernicus.eu
- references :
- http://www.globcolour.info GlobColour has been originally funded by ESA with data from ESA, NASA, NOAA and GeoEye. This version has received funding from the European Community s Seventh Framework Programme ([FP7/2007-2013]) under grant agreement n. 282723 [OSS2015 project].
- registration :
- 5
- sensor :
- Moderate Resolution Imaging Spectroradiometer,Visible Infrared Imaging Radiometer Suite,Ocean and Land Colour Instrument
- sensor_name :
- MODISA,VIIRSN,OLCIa,VIIRSJ1,OLCIb
- sensor_name_list :
- MOD,VIR,OLA,VJ1,OLB
- site_name :
- GLO
- software_name :
- globcolour_l3_reproject
- software_version :
- 2022.2
- source :
- surface observation
- southernmost_latitude :
- -90.0
- southernmost_valid_latitude :
- -78.58333587646484
- standard_name :
- status_flag
- standard_name_vocabulary :
- NetCDF Climate and Forecast (CF) Metadata Convention
- start_date :
- 2023-11-20 UTC
- start_time :
- 15:24:55 UTC
- stop_date :
- 2023-11-22 UTC
- stop_time :
- 08:12:52 UTC
- summary :
- CMEMS product: cmems_obs-oc_glo_bgc-plankton_my_l4-gapfree-multi-4km_P1D, generated by ACRI-ST
- time_coverage_duration :
- PT146878S
- time_coverage_end :
- 2023-11-22T08:12:52Z
- time_coverage_resolution :
- P1D
- time_coverage_start :
- 2023-11-20T15:24:55Z
- title :
- cmems_obs-oc_glo_bgc-plankton_my_l4-gapfree-multi-4km_P1D
- valid_max :
- 3
- valid_min :
- 0
- westernmost_longitude :
- -180.0
- westernmost_valid_longitude :
- -180.0
Array Chunk Bytes 1.95 MiB 499.89 kiB Shape (12, 177, 241) (3, 177, 241) Dask graph 4 chunks in 214 graph layers Data type float32 numpy.ndarray - CHL_cmes_flags-level3(month, lat, lon)float32dask.array<chunksize=(3, 177, 241), meta=np.ndarray>
- Conventions :
- CF-1.8, ACDD-1.3
- DPM_reference :
- GC-UD-ACRI-PUG
- IODD_reference :
- GC-UD-ACRI-PUG
- acknowledgement :
- The Licensees will ensure that original CMEMS products - or value added products or derivative works developed from CMEMS Products including publications and pictures - shall credit CMEMS by explicitly making mention of the originator (CMEMS) in the following manner: <Generated using CMEMS Products, production centre ACRI-ST>
- citation :
- The Licensees will ensure that original CMEMS products - or value added products or derivative works developed from CMEMS Products including publications and pictures - shall credit CMEMS by explicitly making mention of the originator (CMEMS) in the following manner: <Generated using CMEMS Products, production centre ACRI-ST>
- cmems_product_id :
- OCEANCOLOUR_GLO_BGC_L3_MY_009_103
- cmems_production_unit :
- OC-ACRI-NICE-FR
- comment :
- average
- contact :
- servicedesk.cmems@acri-st.fr
- copernicusmarine_version :
- 1.3.1
- coverage_content_type :
- auxiliaryInformation
- creation_date :
- 2024-04-25 UTC
- creation_time :
- 00:47:33 UTC
- creator_email :
- servicedesk.cmems@acri-st.fr
- creator_name :
- ACRI
- creator_url :
- http://marine.copernicus.eu
- date_created :
- 2024-04-25T00:47:33Z
- distribution_statement :
- See CMEMS Data License
- duration_time :
- PT107179S
- earth_radius :
- 6378.137
- easternmost_longitude :
- 180.0
- easternmost_valid_longitude :
- 180.00001525878906
- file_quality_index :
- 0
- flag_masks :
- 1
- flag_meanings :
- LAND
- geospatial_bounds :
- POLYGON ((90.000000 -180.000000, 90.000000 180.000000, -90.000000 180.000000, -90.000000 -180.000000, 90.000000 -180.000000))
- geospatial_bounds_crs :
- EPSG:4326
- geospatial_bounds_vertical_crs :
- EPSG:5829
- geospatial_lat_max :
- 89.97916412353516
- geospatial_lat_min :
- -89.97917175292969
- geospatial_lon_max :
- 179.9791717529297
- geospatial_lon_min :
- -179.9791717529297
- geospatial_vertical_max :
- 0
- geospatial_vertical_min :
- 0
- geospatial_vertical_positive :
- up
- grid_mapping :
- Equirectangular
- grid_resolution :
- 4.638312339782715
- history :
- Created using software developed at ACRI-ST
- id :
- 20240417_cmems_obs-oc_glo_bgc-plankton_myint_l3-multi-4km_P1D
- institution :
- ACRI
- keywords :
- EARTH SCIENCE > OCEANS > OCEAN CHEMISTRY > CHLOROPHYLL, EARTH SCIENCE > BIOLOGICAL CLASSIFICATION > PROTISTS > PLANKTON > PHYTOPLANKTON
- keywords_vocabulary :
- NASA Global Change Master Directory (GCMD) Science Keywords
- lat_step :
- 0.0416666679084301
- license :
- See CMEMS Data License
- lon_step :
- 0.0416666679084301
- long_name :
- Flags
- naming_authority :
- CMEMS
- nb_bins :
- 37324800
- nb_equ_bins :
- 8640
- nb_grid_bins :
- 37324800
- nb_valid_bins :
- 9704694
- netcdf_version_id :
- 4.3.3.1 of Jul 8 2016 18:15:50 $
- northernmost_latitude :
- 90.0
- northernmost_valid_latitude :
- 82.70833587646484
- overall_quality :
- mode=myint
- parameter :
- Chlorophyll-a concentration,Phytoplankton Functional Types
- parameter_code :
- CHL,DIATO,DINO,HAPTO,GREEN,PROKAR,PROCHLO,MICRO,NANO,PICO
- pct_bins :
- 100.0
- pct_valid_bins :
- 26.000659079218106
- period_duration_day :
- P1D
- period_end_day :
- 20240417
- period_start_day :
- 20240417
- platform :
- Aqua,Suomi-NPP,Sentinel-3a,JPSS-1 (NOAA-20),Sentinel-3b
- processing_level :
- L3
- product_level :
- 3
- product_name :
- 20240417_cmems_obs-oc_glo_bgc-plankton_myint_l3-multi-4km_P1D
- product_type :
- day
- project :
- CMEMS
- publication :
- Gohin, F., Druon, J. N., Lampert, L. (2002). A five channel chlorophyll concentration algorithm applied to SeaWiFS data processed by SeaDAS in coastal waters. International journal of remote sensing, 23(8), 1639-1661 + Hu, C., Lee, Z., Franz, B. (2012). Chlorophyll a algorithms for oligotrophic oceans: A novel approach based on three-band reflectance difference. Journal of Geophysical Research, 117(C1). doi: 10.1029/2011jc007395 + Xi H, Losa S N, Mangin A, Garnesson P, Bretagnon M, Demaria J, Soppa M A, Hembise Fanton d Andon O, Bracher A (2021) Global chlorophyll a concentrations of phytoplankton functional types with detailed uncertainty assessment using multi-sensor ocean color and sea surface temperature satellite products, JGR, in review.
- publisher_email :
- servicedesk.cmems@mercator-ocean.eu
- publisher_name :
- CMEMS
- publisher_url :
- http://marine.copernicus.eu
- references :
- http://www.globcolour.info GlobColour has been originally funded by ESA with data from ESA, NASA, NOAA and GeoEye. This version has received funding from the European Community s Seventh Framework Programme ([FP7/2007-2013]) under grant agreement n. 282723 [OSS2015 project].
- registration :
- 5
- sensor :
- Moderate Resolution Imaging Spectroradiometer,Visible Infrared Imaging Radiometer Suite,Ocean and Land Colour Instrument
- sensor_name :
- MODISA,VIIRSN,OLCIa,VIIRSJ1,OLCIb
- sensor_name_list :
- MOD,VIR,OLA,VJ1,OLB
- site_name :
- GLO
- software_name :
- globcolour_l3_reproject
- software_version :
- 2022.2
- source :
- surface observation
- southernmost_latitude :
- -90.0
- southernmost_valid_latitude :
- -66.33333587646484
- standard_name :
- status_flag
- standard_name_vocabulary :
- NetCDF Climate and Forecast (CF) Metadata Convention
- start_date :
- 2024-04-16 UTC
- start_time :
- 21:12:05 UTC
- stop_date :
- 2024-04-18 UTC
- stop_time :
- 02:58:23 UTC
- summary :
- CMEMS product: cmems_obs-oc_glo_bgc-plankton_my_l3-multi-4km_P1D, generated by ACRI-ST
- time_coverage_duration :
- PT107179S
- time_coverage_end :
- 2024-04-18T02:58:23Z
- time_coverage_resolution :
- P1D
- time_coverage_start :
- 2024-04-16T21:12:05Z
- title :
- cmems_obs-oc_glo_bgc-plankton_my_l3-multi-4km_P1D
- valid_max :
- 1
- valid_min :
- 0
- westernmost_longitude :
- -180.0
- westernmost_valid_longitude :
- -180.0
Array Chunk Bytes 1.95 MiB 499.89 kiB Shape (12, 177, 241) (3, 177, 241) Dask graph 4 chunks in 214 graph layers Data type float32 numpy.ndarray - CHL_cmes_uncertainty-gapfree(month, lat, lon)float32dask.array<chunksize=(3, 177, 241), meta=np.ndarray>
- Conventions :
- CF-1.8, ACDD-1.3
- DPM_reference :
- GC-UD-ACRI-PUG
- IODD_reference :
- GC-UD-ACRI-PUG
- acknowledgement :
- The Licensees will ensure that original CMEMS products - or value added products or derivative works developed from CMEMS Products including publications and pictures - shall credit CMEMS by explicitly making mention of the originator (CMEMS) in the following manner: <Generated using CMEMS Products, production centre ACRI-ST>
- citation :
- The Licensees will ensure that original CMEMS products - or value added products or derivative works developed from CMEMS Products including publications and pictures - shall credit CMEMS by explicitly making mention of the originator (CMEMS) in the following manner: <Generated using CMEMS Products, production centre ACRI-ST>
- cmems_product_id :
- OCEANCOLOUR_GLO_BGC_L4_MY_009_104
- cmems_production_unit :
- OC-ACRI-NICE-FR
- comment :
- average
- contact :
- servicedesk.cmems@acri-st.fr
- copernicusmarine_version :
- 1.3.1
- coverage_content_type :
- qualityInformation
- creation_date :
- 2023-11-29 UTC
- creation_time :
- 01:06:50 UTC
- creator_email :
- servicedesk.cmems@acri-st.fr
- creator_name :
- ACRI
- creator_url :
- http://marine.copernicus.eu
- date_created :
- 2023-11-29T01:06:50Z
- distribution_statement :
- See CMEMS Data License
- duration_time :
- PT146878S
- earth_radius :
- 6378.137
- easternmost_longitude :
- 180.0
- easternmost_valid_longitude :
- 180.00001525878906
- file_quality_index :
- 0
- geospatial_bounds :
- POLYGON ((90.000000 -180.000000, 90.000000 180.000000, -90.000000 180.000000, -90.000000 -180.000000, 90.000000 -180.000000))
- geospatial_bounds_crs :
- EPSG:4326
- geospatial_bounds_vertical_crs :
- EPSG:5829
- geospatial_lat_max :
- 89.97916412353516
- geospatial_lat_min :
- -89.97917175292969
- geospatial_lon_max :
- 179.9791717529297
- geospatial_lon_min :
- -179.9791717529297
- geospatial_vertical_max :
- 0
- geospatial_vertical_min :
- 0
- geospatial_vertical_positive :
- up
- grid_mapping :
- Equirectangular
- grid_resolution :
- 4.638312339782715
- history :
- Created using software developed at ACRI-ST
- id :
- 20231121_cmems_obs-oc_glo_bgc-plankton_myint_l4-gapfree-multi-4km_P1D
- institution :
- ACRI
- keywords :
- EARTH SCIENCE > OCEANS > OCEAN CHEMISTRY > CHLOROPHYLL
- keywords_vocabulary :
- NASA Global Change Master Directory (GCMD) Science Keywords
- lat_step :
- 0.0416666679084301
- license :
- See CMEMS Data License
- lon_step :
- 0.0416666679084301
- long_name :
- Chlorophyll-a concentration - Uncertainty estimation
- naming_authority :
- CMEMS
- nb_bins :
- 37324800
- nb_equ_bins :
- 8640
- nb_grid_bins :
- 37324800
- nb_valid_bins :
- 19169208
- netcdf_version_id :
- 4.3.3.1 of Jul 8 2016 18:15:50 $
- northernmost_latitude :
- 90.0
- northernmost_valid_latitude :
- 58.08333206176758
- overall_quality :
- mode=myint
- parameter :
- Chlorophyll-a concentration
- parameter_code :
- CHL
- pct_bins :
- 100.0
- pct_valid_bins :
- 51.357831790123456
- period_duration_day :
- P1D
- period_end_day :
- 20231121
- period_start_day :
- 20231121
- platform :
- Aqua,Suomi-NPP,Sentinel-3a,JPSS-1 (NOAA-20),Sentinel-3b
- processing_level :
- L4
- product_level :
- 4
- product_name :
- 20231121_cmems_obs-oc_glo_bgc-plankton_myint_l4-gapfree-multi-4km_P1D
- product_type :
- day
- project :
- CMEMS
- publication :
- Gohin, F., Druon, J. N., Lampert, L. (2002). A five channel chlorophyll concentration algorithm applied to SeaWiFS data processed by SeaDAS in coastal waters. International journal of remote sensing, 23(8), 1639-1661 + Hu, C., Lee, Z., Franz, B. (2012). Chlorophyll a algorithms for oligotrophic oceans: A novel approach based on three-band reflectance difference. Journal of Geophysical Research, 117(C1). doi: 10.1029/2011jc007395
- publisher_email :
- servicedesk.cmems@mercator-ocean.eu
- publisher_name :
- CMEMS
- publisher_url :
- http://marine.copernicus.eu
- references :
- http://www.globcolour.info GlobColour has been originally funded by ESA with data from ESA, NASA, NOAA and GeoEye. This version has received funding from the European Community s Seventh Framework Programme ([FP7/2007-2013]) under grant agreement n. 282723 [OSS2015 project].
- registration :
- 5
- sensor :
- Moderate Resolution Imaging Spectroradiometer,Visible Infrared Imaging Radiometer Suite,Ocean and Land Colour Instrument
- sensor_name :
- MODISA,VIIRSN,OLCIa,VIIRSJ1,OLCIb
- sensor_name_list :
- MOD,VIR,OLA,VJ1,OLB
- site_name :
- GLO
- software_name :
- globcolour_l3_reproject
- software_version :
- 2022.2
- source :
- surface observation
- southernmost_latitude :
- -90.0
- southernmost_valid_latitude :
- -78.58333587646484
- standard_name_vocabulary :
- NetCDF Climate and Forecast (CF) Metadata Convention
- start_date :
- 2023-11-20 UTC
- start_time :
- 15:24:55 UTC
- stop_date :
- 2023-11-22 UTC
- stop_time :
- 08:12:52 UTC
- summary :
- CMEMS product: cmems_obs-oc_glo_bgc-plankton_my_l4-gapfree-multi-4km_P1D, generated by ACRI-ST
- time_coverage_duration :
- PT146878S
- time_coverage_end :
- 2023-11-22T08:12:52Z
- time_coverage_resolution :
- P1D
- time_coverage_start :
- 2023-11-20T15:24:55Z
- title :
- cmems_obs-oc_glo_bgc-plankton_my_l4-gapfree-multi-4km_P1D
- units :
- %
- valid_max :
- 32767
- valid_min :
- 0
- westernmost_longitude :
- -180.0
- westernmost_valid_longitude :
- -180.0
Array Chunk Bytes 1.95 MiB 499.89 kiB Shape (12, 177, 241) (3, 177, 241) Dask graph 4 chunks in 214 graph layers Data type float32 numpy.ndarray - CHL_cmes_uncertainty-level3(month, lat, lon)float32dask.array<chunksize=(3, 177, 241), meta=np.ndarray>
- Conventions :
- CF-1.8, ACDD-1.3
- DPM_reference :
- GC-UD-ACRI-PUG
- IODD_reference :
- GC-UD-ACRI-PUG
- acknowledgement :
- The Licensees will ensure that original CMEMS products - or value added products or derivative works developed from CMEMS Products including publications and pictures - shall credit CMEMS by explicitly making mention of the originator (CMEMS) in the following manner: <Generated using CMEMS Products, production centre ACRI-ST>
- citation :
- The Licensees will ensure that original CMEMS products - or value added products or derivative works developed from CMEMS Products including publications and pictures - shall credit CMEMS by explicitly making mention of the originator (CMEMS) in the following manner: <Generated using CMEMS Products, production centre ACRI-ST>
- cmems_product_id :
- OCEANCOLOUR_GLO_BGC_L3_MY_009_103
- cmems_production_unit :
- OC-ACRI-NICE-FR
- comment :
- average
- contact :
- servicedesk.cmems@acri-st.fr
- copernicusmarine_version :
- 1.3.1
- coverage_content_type :
- qualityInformation
- creation_date :
- 2024-04-25 UTC
- creation_time :
- 00:47:33 UTC
- creator_email :
- servicedesk.cmems@acri-st.fr
- creator_name :
- ACRI
- creator_url :
- http://marine.copernicus.eu
- date_created :
- 2024-04-25T00:47:33Z
- distribution_statement :
- See CMEMS Data License
- duration_time :
- PT107179S
- earth_radius :
- 6378.137
- easternmost_longitude :
- 180.0
- easternmost_valid_longitude :
- 180.00001525878906
- file_quality_index :
- 0
- geospatial_bounds :
- POLYGON ((90.000000 -180.000000, 90.000000 180.000000, -90.000000 180.000000, -90.000000 -180.000000, 90.000000 -180.000000))
- geospatial_bounds_crs :
- EPSG:4326
- geospatial_bounds_vertical_crs :
- EPSG:5829
- geospatial_lat_max :
- 89.97916412353516
- geospatial_lat_min :
- -89.97917175292969
- geospatial_lon_max :
- 179.9791717529297
- geospatial_lon_min :
- -179.9791717529297
- geospatial_vertical_max :
- 0
- geospatial_vertical_min :
- 0
- geospatial_vertical_positive :
- up
- grid_mapping :
- Equirectangular
- grid_resolution :
- 4.638312339782715
- history :
- Created using software developed at ACRI-ST
- id :
- 20240417_cmems_obs-oc_glo_bgc-plankton_myint_l3-multi-4km_P1D
- institution :
- ACRI
- keywords :
- EARTH SCIENCE > OCEANS > OCEAN CHEMISTRY > CHLOROPHYLL, EARTH SCIENCE > BIOLOGICAL CLASSIFICATION > PROTISTS > PLANKTON > PHYTOPLANKTON
- keywords_vocabulary :
- NASA Global Change Master Directory (GCMD) Science Keywords
- lat_step :
- 0.0416666679084301
- license :
- See CMEMS Data License
- lon_step :
- 0.0416666679084301
- long_name :
- Chlorophyll-a concentration - Uncertainty estimation
- naming_authority :
- CMEMS
- nb_bins :
- 37324800
- nb_equ_bins :
- 8640
- nb_grid_bins :
- 37324800
- nb_valid_bins :
- 9704694
- netcdf_version_id :
- 4.3.3.1 of Jul 8 2016 18:15:50 $
- northernmost_latitude :
- 90.0
- northernmost_valid_latitude :
- 82.70833587646484
- overall_quality :
- mode=myint
- parameter :
- Chlorophyll-a concentration,Phytoplankton Functional Types
- parameter_code :
- CHL,DIATO,DINO,HAPTO,GREEN,PROKAR,PROCHLO,MICRO,NANO,PICO
- pct_bins :
- 100.0
- pct_valid_bins :
- 26.000659079218106
- period_duration_day :
- P1D
- period_end_day :
- 20240417
- period_start_day :
- 20240417
- platform :
- Aqua,Suomi-NPP,Sentinel-3a,JPSS-1 (NOAA-20),Sentinel-3b
- processing_level :
- L3
- product_level :
- 3
- product_name :
- 20240417_cmems_obs-oc_glo_bgc-plankton_myint_l3-multi-4km_P1D
- product_type :
- day
- project :
- CMEMS
- publication :
- Gohin, F., Druon, J. N., Lampert, L. (2002). A five channel chlorophyll concentration algorithm applied to SeaWiFS data processed by SeaDAS in coastal waters. International journal of remote sensing, 23(8), 1639-1661 + Hu, C., Lee, Z., Franz, B. (2012). Chlorophyll a algorithms for oligotrophic oceans: A novel approach based on three-band reflectance difference. Journal of Geophysical Research, 117(C1). doi: 10.1029/2011jc007395 + Xi H, Losa S N, Mangin A, Garnesson P, Bretagnon M, Demaria J, Soppa M A, Hembise Fanton d Andon O, Bracher A (2021) Global chlorophyll a concentrations of phytoplankton functional types with detailed uncertainty assessment using multi-sensor ocean color and sea surface temperature satellite products, JGR, in review.
- publisher_email :
- servicedesk.cmems@mercator-ocean.eu
- publisher_name :
- CMEMS
- publisher_url :
- http://marine.copernicus.eu
- references :
- http://www.globcolour.info GlobColour has been originally funded by ESA with data from ESA, NASA, NOAA and GeoEye. This version has received funding from the European Community s Seventh Framework Programme ([FP7/2007-2013]) under grant agreement n. 282723 [OSS2015 project].
- registration :
- 5
- sensor :
- Moderate Resolution Imaging Spectroradiometer,Visible Infrared Imaging Radiometer Suite,Ocean and Land Colour Instrument
- sensor_name :
- MODISA,VIIRSN,OLCIa,VIIRSJ1,OLCIb
- sensor_name_list :
- MOD,VIR,OLA,VJ1,OLB
- site_name :
- GLO
- software_name :
- globcolour_l3_reproject
- software_version :
- 2022.2
- source :
- surface observation
- southernmost_latitude :
- -90.0
- southernmost_valid_latitude :
- -66.33333587646484
- standard_name_vocabulary :
- NetCDF Climate and Forecast (CF) Metadata Convention
- start_date :
- 2024-04-16 UTC
- start_time :
- 21:12:05 UTC
- stop_date :
- 2024-04-18 UTC
- stop_time :
- 02:58:23 UTC
- summary :
- CMEMS product: cmems_obs-oc_glo_bgc-plankton_my_l3-multi-4km_P1D, generated by ACRI-ST
- time_coverage_duration :
- PT107179S
- time_coverage_end :
- 2024-04-18T02:58:23Z
- time_coverage_resolution :
- P1D
- time_coverage_start :
- 2024-04-16T21:12:05Z
- title :
- cmems_obs-oc_glo_bgc-plankton_my_l3-multi-4km_P1D
- units :
- %
- valid_max :
- 32767
- valid_min :
- 0
- westernmost_longitude :
- -180.0
- westernmost_valid_longitude :
- -180.0
Array Chunk Bytes 1.95 MiB 499.89 kiB Shape (12, 177, 241) (3, 177, 241) Dask graph 4 chunks in 214 graph layers Data type float32 numpy.ndarray - CHL_uncertainty(month, lat, lon)float32dask.array<chunksize=(3, 177, 241), meta=np.ndarray>
- _ChunkSizes :
- [1, 256, 256]
- coverage_content_type :
- qualityInformation
- long_name :
- Chlorophyll-a concentration - Uncertainty estimation
- units :
- %
- valid_max :
- 32767
- valid_min :
- 0
Array Chunk Bytes 1.95 MiB 499.89 kiB Shape (12, 177, 241) (3, 177, 241) Dask graph 4 chunks in 214 graph layers Data type float32 numpy.ndarray - adt(month, lat, lon)float32dask.array<chunksize=(3, 177, 241), meta=np.ndarray>
- comment :
- The absolute dynamic topography is the sea surface height above geoid; the adt is obtained as follows: adt=sla+mdt where mdt is the mean dynamic topography; see the product user manual for details
- grid_mapping :
- crs
- long_name :
- Absolute dynamic topography
- standard_name :
- sea_surface_height_above_geoid
- units :
- m
Array Chunk Bytes 1.95 MiB 499.89 kiB Shape (12, 177, 241) (3, 177, 241) Dask graph 4 chunks in 214 graph layers Data type float32 numpy.ndarray - air_temp(month, lat, lon)float32dask.array<chunksize=(3, 177, 241), meta=np.ndarray>
- long_name :
- 2 metre temperature
- nameCDM :
- 2_metre_temperature_surface
- nameECMWF :
- 2 metre temperature
- product_type :
- analysis
- shortNameECMWF :
- 2t
- standard_name :
- air_temperature
- units :
- K
Array Chunk Bytes 1.95 MiB 499.89 kiB Shape (12, 177, 241) (3, 177, 241) Dask graph 4 chunks in 214 graph layers Data type float32 numpy.ndarray - curr_dir(month, lat, lon)float32dask.array<chunksize=(3, 177, 241), meta=np.ndarray>
- comments :
- Computed from total surface current velocity elements. Velocities are an average over the top 30m of the mixed layer
- depth :
- 15m
- long_name :
- average direction of total surface currents
- units :
- degrees
Array Chunk Bytes 1.95 MiB 499.89 kiB Shape (12, 177, 241) (3, 177, 241) Dask graph 4 chunks in 214 graph layers Data type float32 numpy.ndarray - curr_speed(month, lat, lon)float32dask.array<chunksize=(3, 177, 241), meta=np.ndarray>
- comments :
- Velocities are an average over the top 30m of the mixed layer
- depth :
- 15m
- long_name :
- average total surface current speed
- units :
- m s**-1
Array Chunk Bytes 1.95 MiB 499.89 kiB Shape (12, 177, 241) (3, 177, 241) Dask graph 4 chunks in 214 graph layers Data type float32 numpy.ndarray - mlotst(month, lat, lon)float32dask.array<chunksize=(12, 177, 241), meta=np.ndarray>
- _ChunkSizes :
- [1, 681, 1440]
- cell_methods :
- area: mean
- long_name :
- Density ocean mixed layer thickness
- standard_name :
- ocean_mixed_layer_thickness_defined_by_sigma_theta
- unit_long :
- Meters
- units :
- m
Array Chunk Bytes 1.95 MiB 1.95 MiB Shape (12, 177, 241) (12, 177, 241) Dask graph 1 chunks in 55 graph layers Data type float32 numpy.ndarray - sla(month, lat, lon)float32dask.array<chunksize=(3, 177, 241), meta=np.ndarray>
- ancillary_variables :
- err_sla
- comment :
- The sea level anomaly is the sea surface height above mean sea surface; it is referenced to the [1993, 2012] period; see the product user manual for details
- grid_mapping :
- crs
- long_name :
- Sea level anomaly
- standard_name :
- sea_surface_height_above_sea_level
- units :
- m
Array Chunk Bytes 1.95 MiB 499.89 kiB Shape (12, 177, 241) (3, 177, 241) Dask graph 4 chunks in 214 graph layers Data type float32 numpy.ndarray - so(month, lat, lon)float32dask.array<chunksize=(12, 177, 241), meta=np.ndarray>
- _ChunkSizes :
- [1, 7, 341, 720]
- cell_methods :
- area: mean
- long_name :
- mean sea water salinity at 0.49 metres below ocean surface
- standard_name :
- sea_water_salinity
- unit_long :
- Practical Salinity Unit
- units :
- 1e-3
- valid_max :
- 28336
- valid_min :
- 1
Array Chunk Bytes 1.95 MiB 1.95 MiB Shape (12, 177, 241) (12, 177, 241) Dask graph 1 chunks in 55 graph layers Data type float32 numpy.ndarray - sst(month, lat, lon)float32dask.array<chunksize=(3, 177, 241), meta=np.ndarray>
- long_name :
- Sea surface temperature
- nameCDM :
- Sea_surface_temperature_surface
- nameECMWF :
- Sea surface temperature
- product_type :
- analysis
- shortNameECMWF :
- sst
- standard_name :
- sea_surface_temperature
- units :
- K
Array Chunk Bytes 1.95 MiB 499.89 kiB Shape (12, 177, 241) (3, 177, 241) Dask graph 4 chunks in 214 graph layers Data type float32 numpy.ndarray - u_curr(month, lat, lon)float32dask.array<chunksize=(3, 177, 241), meta=np.ndarray>
- comment :
- Velocities are an average over the top 30m of the mixed layer
- coverage_content_type :
- modelResult
- depth :
- 15m
- long_name :
- zonal total surface current
- source :
- SSH source: CMEMS SSALTO/DUACS SEALEVEL_GLO_PHY_L4_MY_008_047 DOI: 10.48670/moi-00148 ; WIND source: ECMWF ERA5 10m wind DOI: 10.24381/cds.adbb2d47 ; SST source: CMC 0.2 deg SST V2.0 DOI: 10.5067/GHCMC-4FM02
- standard_name :
- eastward_sea_water_velocity
- units :
- m s-1
- valid_max :
- 3.0
- valid_min :
- -3.0
Array Chunk Bytes 1.95 MiB 499.89 kiB Shape (12, 177, 241) (3, 177, 241) Dask graph 4 chunks in 214 graph layers Data type float32 numpy.ndarray - u_wind(month, lat, lon)float32dask.array<chunksize=(3, 177, 241), meta=np.ndarray>
- long_name :
- 10 metre U wind component
- nameCDM :
- 10_metre_U_wind_component_surface
- nameECMWF :
- 10 metre U wind component
- product_type :
- analysis
- shortNameECMWF :
- 10u
- standard_name :
- eastward_wind
- units :
- m s**-1
Array Chunk Bytes 1.95 MiB 499.89 kiB Shape (12, 177, 241) (3, 177, 241) Dask graph 4 chunks in 214 graph layers Data type float32 numpy.ndarray - ug_curr(month, lat, lon)float32dask.array<chunksize=(3, 177, 241), meta=np.ndarray>
- comment :
- Geostrophic velocities calculated from absolute dynamic topography
- depth :
- 15m
- long_name :
- zonal geostrophic surface current
- source :
- SSH source: CMEMS SSALTO/DUACS SEALEVEL_GLO_PHY_L4_MY_008_047 DOI: 10.48670/moi-00148
- standard_name :
- geostrophic_eastward_sea_water_velocity
- units :
- m s-1
- valid_max :
- 3.0
- valid_min :
- -3.0
Array Chunk Bytes 1.95 MiB 499.89 kiB Shape (12, 177, 241) (3, 177, 241) Dask graph 4 chunks in 214 graph layers Data type float32 numpy.ndarray - v_curr(month, lat, lon)float32dask.array<chunksize=(3, 177, 241), meta=np.ndarray>
- comment :
- Velocities are an average over the top 30m of the mixed layer
- coverage_content_type :
- modelResult
- depth :
- 15m
- long_name :
- meridional total surface current
- source :
- SSH source: CMEMS SSALTO/DUACS SEALEVEL_GLO_PHY_L4_MY_008_047 DOI: 10.48670/moi-00148 ; WIND source: ECMWF ERA5 10m wind DOI: 10.24381/cds.adbb2d47 ; SST source: CMC 0.2 deg SST V2.0 DOI: 10.5067/GHCMC-4FM02
- standard_name :
- northward_sea_water_velocity
- units :
- m s-1
- valid_max :
- 3.0
- valid_min :
- -3.0
Array Chunk Bytes 1.95 MiB 499.89 kiB Shape (12, 177, 241) (3, 177, 241) Dask graph 4 chunks in 214 graph layers Data type float32 numpy.ndarray - v_wind(month, lat, lon)float32dask.array<chunksize=(3, 177, 241), meta=np.ndarray>
- long_name :
- 10 metre V wind component
- nameCDM :
- 10_metre_V_wind_component_surface
- nameECMWF :
- 10 metre V wind component
- product_type :
- analysis
- shortNameECMWF :
- 10v
- standard_name :
- northward_wind
- units :
- m s**-1
Array Chunk Bytes 1.95 MiB 499.89 kiB Shape (12, 177, 241) (3, 177, 241) Dask graph 4 chunks in 214 graph layers Data type float32 numpy.ndarray - vg_curr(month, lat, lon)float32dask.array<chunksize=(3, 177, 241), meta=np.ndarray>
- comment :
- Geostrophic velocities calculated from absolute dynamic topography
- depth :
- 15m
- long_name :
- meridional geostrophic surface current
- source :
- SSH source: CMEMS SSALTO/DUACS SEALEVEL_GLO_PHY_L4_MY_008_047 DOI: 10.48670/moi-00148
- standard_name :
- geostrophic_northward_sea_water_velocity
- units :
- m s-1
- valid_max :
- 3.0
- valid_min :
- -3.0
Array Chunk Bytes 1.95 MiB 499.89 kiB Shape (12, 177, 241) (3, 177, 241) Dask graph 4 chunks in 214 graph layers Data type float32 numpy.ndarray - wind_dir(month, lat, lon)float32dask.array<chunksize=(3, 177, 241), meta=np.ndarray>
- long_name :
- 10 metre wind direction
- units :
- degrees
Array Chunk Bytes 1.95 MiB 499.89 kiB Shape (12, 177, 241) (3, 177, 241) Dask graph 4 chunks in 214 graph layers Data type float32 numpy.ndarray - wind_speed(month, lat, lon)float32dask.array<chunksize=(3, 177, 241), meta=np.ndarray>
- long_name :
- 10 metre absolute speed
- units :
- m s**-1
Array Chunk Bytes 1.95 MiB 499.89 kiB Shape (12, 177, 241) (3, 177, 241) Dask graph 4 chunks in 214 graph layers Data type float32 numpy.ndarray - CHL_cmes-land(month, lat, lon)float64dask.array<chunksize=(12, 177, 241), meta=np.ndarray>
Array Chunk Bytes 3.91 MiB 3.91 MiB Shape (12, 177, 241) (12, 177, 241) Dask graph 1 chunks in 8 graph layers Data type float64 numpy.ndarray - topo(month, lat, lon)float64dask.array<chunksize=(12, 177, 241), meta=np.ndarray>
- colorBarMaximum :
- 8000.0
- colorBarMinimum :
- -8000.0
- colorBarPalette :
- Topography
- grid_mapping :
- GDAL_Geographics
- ioos_category :
- Location
- long_name :
- Topography
- standard_name :
- altitude
- units :
- meters
Array Chunk Bytes 3.91 MiB 3.91 MiB Shape (12, 177, 241) (12, 177, 241) Dask graph 1 chunks in 8 graph layers Data type float64 numpy.ndarray
- latPandasIndex
PandasIndex(Index([ 32.0, 31.75, 31.5, 31.25, 31.0, 30.75, 30.5, 30.25, 30.0, 29.75, ... -9.75, -10.0, -10.25, -10.5, -10.75, -11.0, -11.25, -11.5, -11.75, -12.0], dtype='float32', name='lat', length=177)) - lonPandasIndex
PandasIndex(Index([ 42.0, 42.25, 42.5, 42.75, 43.0, 43.25, 43.5, 43.75, 44.0, 44.25, ... 99.75, 100.0, 100.25, 100.5, 100.75, 101.0, 101.25, 101.5, 101.75, 102.0], dtype='float32', name='lon', length=241)) - monthPandasIndex
PandasIndex(Index([1, 2, 3, 4, 5, 6, 7, 8, 9, 10, 11, 12], dtype='int64', name='month'))
- Conventions :
- CF-1.8, ACDD-1.3
- DPM_reference :
- GC-UD-ACRI-PUG
- IODD_reference :
- GC-UD-ACRI-PUG
- acknowledgement :
- The Licensees will ensure that original CMEMS products - or value added products or derivative works developed from CMEMS Products including publications and pictures - shall credit CMEMS by explicitly making mention of the originator (CMEMS) in the following manner: <Generated using CMEMS Products, production centre ACRI-ST>
- citation :
- The Licensees will ensure that original CMEMS products - or value added products or derivative works developed from CMEMS Products including publications and pictures - shall credit CMEMS by explicitly making mention of the originator (CMEMS) in the following manner: <Generated using CMEMS Products, production centre ACRI-ST>
- cmems_product_id :
- OCEANCOLOUR_GLO_BGC_L3_MY_009_103
- cmems_production_unit :
- OC-ACRI-NICE-FR
- comment :
- average
- contact :
- servicedesk.cmems@acri-st.fr
- copernicusmarine_version :
- 1.3.1
- creation_date :
- 2024-04-25 UTC
- creation_time :
- 00:47:33 UTC
- creator_email :
- servicedesk.cmems@acri-st.fr
- creator_name :
- ACRI
- creator_url :
- http://marine.copernicus.eu
- date_created :
- 2024-04-25T00:47:33Z
- distribution_statement :
- See CMEMS Data License
- duration_time :
- PT107179S
- earth_radius :
- 6378.137
- easternmost_longitude :
- 180.0
- easternmost_valid_longitude :
- 180.00001525878906
- file_quality_index :
- 0
- geospatial_bounds :
- POLYGON ((90.000000 -180.000000, 90.000000 180.000000, -90.000000 180.000000, -90.000000 -180.000000, 90.000000 -180.000000))
- geospatial_bounds_crs :
- EPSG:4326
- geospatial_bounds_vertical_crs :
- EPSG:5829
- geospatial_lat_max :
- 89.97916412353516
- geospatial_lat_min :
- -89.97917175292969
- geospatial_lon_max :
- 179.9791717529297
- geospatial_lon_min :
- -179.9791717529297
- geospatial_vertical_max :
- 0
- geospatial_vertical_min :
- 0
- geospatial_vertical_positive :
- up
- grid_mapping :
- Equirectangular
- grid_resolution :
- 4.638312339782715
- history :
- Created using software developed at ACRI-ST
- id :
- 20240417_cmems_obs-oc_glo_bgc-plankton_myint_l3-multi-4km_P1D
- institution :
- ACRI
- keywords :
- EARTH SCIENCE > OCEANS > OCEAN CHEMISTRY > CHLOROPHYLL, EARTH SCIENCE > BIOLOGICAL CLASSIFICATION > PROTISTS > PLANKTON > PHYTOPLANKTON
- keywords_vocabulary :
- NASA Global Change Master Directory (GCMD) Science Keywords
- lat_step :
- 0.0416666679084301
- license :
- See CMEMS Data License
- lon_step :
- 0.0416666679084301
- naming_authority :
- CMEMS
- nb_bins :
- 37324800
- nb_equ_bins :
- 8640
- nb_grid_bins :
- 37324800
- nb_valid_bins :
- 9704694
- netcdf_version_id :
- 4.3.3.1 of Jul 8 2016 18:15:50 $
- northernmost_latitude :
- 90.0
- northernmost_valid_latitude :
- 82.70833587646484
- overall_quality :
- mode=myint
- parameter :
- Chlorophyll-a concentration,Phytoplankton Functional Types
- parameter_code :
- CHL,DIATO,DINO,HAPTO,GREEN,PROKAR,PROCHLO,MICRO,NANO,PICO
- pct_bins :
- 100.0
- pct_valid_bins :
- 26.000659079218106
- period_duration_day :
- P1D
- period_end_day :
- 20240417
- period_start_day :
- 20240417
- platform :
- Aqua,Suomi-NPP,Sentinel-3a,JPSS-1 (NOAA-20),Sentinel-3b
- processing_level :
- L3
- product_level :
- 3
- product_name :
- 20240417_cmems_obs-oc_glo_bgc-plankton_myint_l3-multi-4km_P1D
- product_type :
- day
- project :
- CMEMS
- publication :
- Gohin, F., Druon, J. N., Lampert, L. (2002). A five channel chlorophyll concentration algorithm applied to SeaWiFS data processed by SeaDAS in coastal waters. International journal of remote sensing, 23(8), 1639-1661 + Hu, C., Lee, Z., Franz, B. (2012). Chlorophyll a algorithms for oligotrophic oceans: A novel approach based on three-band reflectance difference. Journal of Geophysical Research, 117(C1). doi: 10.1029/2011jc007395 + Xi H, Losa S N, Mangin A, Garnesson P, Bretagnon M, Demaria J, Soppa M A, Hembise Fanton d Andon O, Bracher A (2021) Global chlorophyll a concentrations of phytoplankton functional types with detailed uncertainty assessment using multi-sensor ocean color and sea surface temperature satellite products, JGR, in review.
- publisher_email :
- servicedesk.cmems@mercator-ocean.eu
- publisher_name :
- CMEMS
- publisher_url :
- http://marine.copernicus.eu
- references :
- http://www.globcolour.info GlobColour has been originally funded by ESA with data from ESA, NASA, NOAA and GeoEye. This version has received funding from the European Community s Seventh Framework Programme ([FP7/2007-2013]) under grant agreement n. 282723 [OSS2015 project].
- registration :
- 5
- sensor :
- Moderate Resolution Imaging Spectroradiometer,Visible Infrared Imaging Radiometer Suite,Ocean and Land Colour Instrument
- sensor_name :
- MODISA,VIIRSN,OLCIa,VIIRSJ1,OLCIb
- sensor_name_list :
- MOD,VIR,OLA,VJ1,OLB
- site_name :
- GLO
- software_name :
- globcolour_l3_reproject
- software_version :
- 2022.2
- source :
- surface observation
- southernmost_latitude :
- -90.0
- southernmost_valid_latitude :
- -66.33333587646484
- standard_name_vocabulary :
- NetCDF Climate and Forecast (CF) Metadata Convention
- start_date :
- 2024-04-16 UTC
- start_time :
- 21:12:05 UTC
- stop_date :
- 2024-04-18 UTC
- stop_time :
- 02:58:23 UTC
- summary :
- CMEMS product: cmems_obs-oc_glo_bgc-plankton_my_l3-multi-4km_P1D, generated by ACRI-ST
- time_coverage_duration :
- PT107179S
- time_coverage_end :
- 2024-04-18T02:58:23Z
- time_coverage_resolution :
- P1D
- time_coverage_start :
- 2024-04-16T21:12:05Z
- title :
- cmems_obs-oc_glo_bgc-plankton_my_l3-multi-4km_P1D
- westernmost_longitude :
- -180.0
- westernmost_valid_longitude :
- -180.0
Chlorophyl#
norm = LogNorm(vmin=0.00001, vmax=15., clip=True)
ds_clm["CHL_cmes-gapfree"].plot(col="month", col_wrap=4, norm=norm, cmap=cmocean.cm.algae)
<xarray.plot.facetgrid.FacetGrid at 0x7fdac04dffd0>
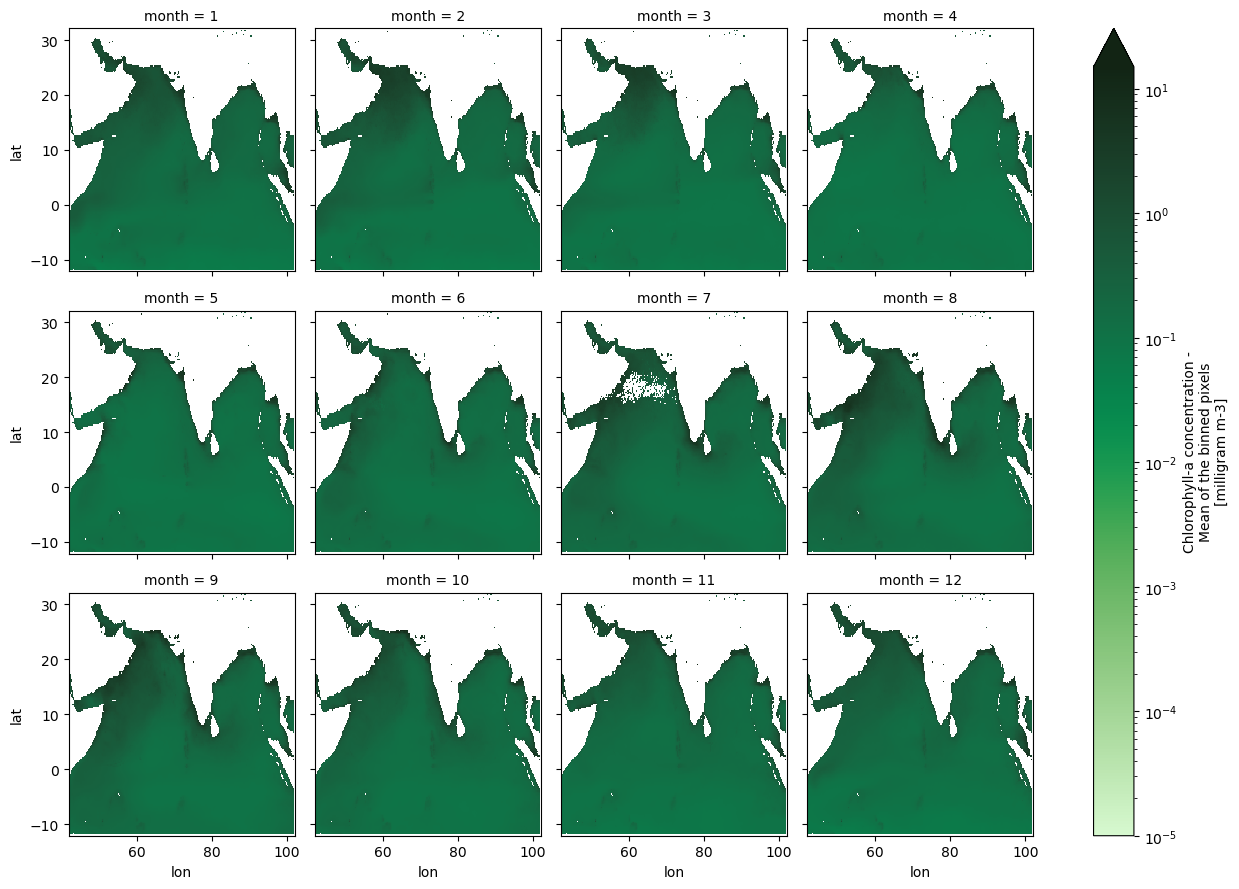
SST#
ds_clm.sst.plot(col="month", col_wrap=4, cmap=cmocean.cm.thermal)
<xarray.plot.facetgrid.FacetGrid at 0x7fdac0a9b090>
ds_clm.v_curr.max().values
array(1.5294565, dtype=float32)
every=8
p = ds_clm.isel(lon=slice(None,None,every), lat=slice(None,None,every)).plot.quiver(x="lon", y="lat",
            u="u_curr", v="v_curr",
            hue="curr_speed",
            cmap=cmocean.cm.speed,
            scale=2,
            subplot_kws={"projection": projection},
            transform=ccrs.PlateCarree(),
            cbar_kwargs={"orientation": "horizontal", },
            col="month", col_wrap=4)

[ax.axes.coastlines() for ax in p.axs.flat];
ds_clm["CHL_cmes-gapfree"].hvplot(groupby="month", cnorm="log")